- Home
- :
- All Communities
- :
- Industries
- :
- Education
- :
- Education Blog
- :
- Mapping and Analyzing data from the GLOBE program ...
Mapping and Analyzing data from the GLOBE program in ArcGIS Online
- Subscribe to RSS Feed
- Mark as New
- Mark as Read
- Bookmark
- Subscribe
- Printer Friendly Page
The Esri education outreach team and GLOBE have been working together for over 20 years. It makes sense given the commitment that both organizations have for meaningful educational experiences, including the collection and analysis of field data. I recently conducted a webinar for GLOBE educators--my presentation is here and the video is here. In each, I focused on key ways that GLOBE data can be easily imported, mapped, and analyzed in ArcGIS Online, including the mapping of spreadsheets of student-collected data about weather, water, soils, and other phenomena downloaded from the GLOBE website. The latitude-longitude values along with the attributes are almost instantaneously able to be displayed on maps in ArcGIS Online. I also discussed field apps such as Survey123, which can be used by GLOBE students and their instructors to gather data in the field in a survey form in citizen science mode, the results of which are instantly available on a web map.
Once mapped, the data can be analyzed in many ways. For example, statistically significant hot spots can be derived for specific variables describing soil chemistry in a field near a school campus, a surface can be derived from pH or dissolved oxygen from specific points in a river or lake, or a 3D map can be generated of snow depth over a region. In another example, layers from the Living Atlas of the World such as land cover or average date of first frost can be brought into the map for comparison against the field-gathered data. How does the dew point or date of first frost vary by latitude, altitude, or proximity to coasts? Do north-facing vs. south-facing slopes differ in terms of vegetation height or soil moisture?
The data that students have gathered can be compared in map and table form to data gathered by other students halfway around the world. Students can create multimedia web mapping applications such as story maps to present their data to their peers, teachers, or the community.
More capabilities exist, but it is my hope that the presentation and video resource I am sharing here will inspire GLOBE teachers and others to get into the field, gather data, map it, analyze it, and communicate the results.
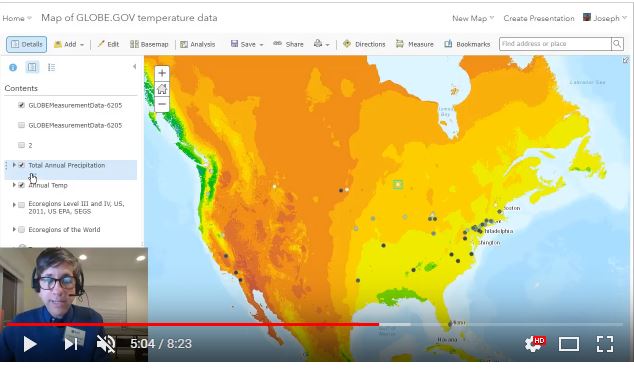
Mapping and analyzing GLOBE data.
You must be a registered user to add a comment. If you've already registered, sign in. Otherwise, register and sign in.
-
Administration
89 -
Announcements
86 -
Career & Tech Ed
1 -
Curriculum-Learning Resources
284 -
Education Facilities
24 -
Events
77 -
GeoInquiries
1 -
Higher Education
618 -
Informal Education
285 -
Licensing Best Practices
102 -
National Geographic MapMaker
41 -
Pedagogy and Education Theory
240 -
Schools (K - 12)
282 -
Schools (K-12)
305 -
Spatial data
39 -
STEM
3 -
Students - Higher Education
258 -
Students - K-12 Schools
144 -
Success Stories
44 -
TeacherDesk
1 -
Tech Tips
127
- « Previous
- Next »