- Home
- :
- All Communities
- :
- Developers
- :
- JavaScript Maps SDK
- :
- JavaScript Maps SDK Questions
- :
- Return Attributes to HTML DIV
- Subscribe to RSS Feed
- Mark Topic as New
- Mark Topic as Read
- Float this Topic for Current User
- Bookmark
- Subscribe
- Mute
- Printer Friendly Page
- Mark as New
- Bookmark
- Subscribe
- Mute
- Subscribe to RSS Feed
- Permalink
Ideas on how to modify this example to return at least one attribute from the layers into an html DIV instead of the length or Count of selected features.
ArcGIS API for JavaScript Sandbox
Preferable I would like:
1. To return attributes values for each record into an HTML Div Tag.
2. Be able to select the graphic and highlight the table record
3. Be able to click the table record and highlight the feature in the map
Anyone have a basic example of this?
Click Map, Create Buffer for selection, Return results into controlled DIV tag, Have interaction between the map and the table of results.
Solved! Go to Solution.
Accepted Solutions
- Mark as New
- Bookmark
- Subscribe
- Mute
- Subscribe to RSS Feed
- Permalink
Jay,
There is not going to be sample for everything you want to do sometimes you have to merge two samples like this then.
<!DOCTYPE html>
<html>
<head>
<meta charset="utf-8">
<meta name="viewport" content="initial-scale=1, maximum-scale=1,user-scalable=no">
<title>Map with a Dojo dGrid</title>
<link rel="stylesheet" href="http://js.arcgis.com/3.25/dojo/resources/dojo.css">
<link rel="stylesheet" href="http://js.arcgis.com/3.25/dgrid/css/dgrid.css">
<link rel="stylesheet" href="http://js.arcgis.com/3.25/dgrid/css/skins/tundra.css">
<link rel="stylesheet" href="http://js.arcgis.com/3.25/dijit/themes/tundra/tundra.css">
<link rel="stylesheet" href="http://js.arcgis.com/3.25/esri/css/esri.css">
<style>
html,
body {
height: 100%;
width: 100%;
margin: 0;
padding: 0;
overflow: hidden;
}
#container {
height: 100%;
visibility: hidden;
}
#bottomPane {
height: 200px;
}
#grid {
height: 100%;
}
.dgrid {
border: none;
}
.field-id {
cursor: pointer;
}
</style>
<script src="http://js.arcgis.com/3.25/"></script>
<script>
// load dgrid, esri and dojo modules
// create the grid and the map
// then parse the dijit layout dijits
require([
"dgrid/OnDemandGrid",
"dgrid/Selection",
"dojo/store/Memory",
"dojo/_base/array",
"dojo/dom-style",
"dijit/registry",
"esri/map",
"esri/layers/FeatureLayer",
"esri/symbols/SimpleMarkerSymbol",
"esri/symbols/SimpleLineSymbol",
"esri/symbols/SimpleFillSymbol",
"esri/Color",
"esri/renderers/SimpleRenderer",
"esri/tasks/QueryTask",
"esri/tasks/query",
"esri/geometry/Circle",
"esri/graphic",
"esri/dijit/PopupTemplate",
"esri/InfoTemplate",
"dojo/_base/declare",
"dojo/number",
"dojo/on",
"dojo/_base/lang",
"dojo/parser",
"dijit/layout/BorderContainer",
"dijit/layout/ContentPane",
"dojo/domReady!"
], function(
Grid,
Selection,
Memory,
array,
domStyle,
registry,
Map,
FeatureLayer,
SimpleMarkerSymbol,
SimpleLineSymbol,
SimpleFillSymbol,
Color,
SimpleRenderer,
QueryTask,
Query,
Circle,
Graphic,
PopupTemplate,
InfoTemplate,
declare,
dojoNum,
on,
lang,
parser
) {
parser.parse();
// create the dgrid
window.grid = new(declare([Grid, Selection]))({
// use Infinity so that all data is available in the grid
bufferRows: Infinity,
columns: {
"id": "ID",
"popuplation": {
"label": "2000 Population",
"formatter": dojoNum.format
},
"households": "Households",
"houseunits": "House Units"
}
}, "grid");
// add a click listener on the ID column
grid.on(".field-id:click", selectBlkPnt);
window.map = new Map("map", {
basemap: "streets",
center: [-95.249, 38.954],
zoom: 14,
});
window.blockUrl = "https://sampleserver6.arcgisonline.com/arcgis/rest/services/Census/MapServer/0";
window.outFields = ["OBJECTID", "POP2000", "HOUSEHOLDS", "HSE_UNITS"];
var fl = new FeatureLayer(window.blockUrl,{
id: "blockPnts",
outFields: ["*"]
});
// Selection symbol used to draw the selected census block points within the buffer polygon
var symbol = new SimpleMarkerSymbol(
SimpleMarkerSymbol.STYLE_CIRCLE,
12,
new SimpleLineSymbol(
SimpleLineSymbol.STYLE_NULL,
new Color([247, 34, 101, 0.9]),
1
),
new Color([207, 34, 171, 0.5])
);
fl.setSelectionSymbol(symbol);
// Make unselected features invisible
var nullSymbol = new SimpleMarkerSymbol().setSize(0);
fl.setRenderer(new SimpleRenderer(nullSymbol));
fl.on("click", selectGrid);
// change cursor to indicate features are click-able
fl.on("mouse-over", function() {
window.mapClickEvt.pause();
map.setMapCursor("pointer");
});
fl.on("mouse-out", function() {
setTimeout(function(){
window.mapClickEvt.resume();
}, 800);
map.setMapCursor("default");
});
map.addLayer(fl);
var circleSymb = new SimpleFillSymbol(
SimpleFillSymbol.STYLE_NULL,
new SimpleLineSymbol(
SimpleLineSymbol.STYLE_SHORTDASHDOTDOT,
new Color([105, 105, 105]),
2
), new Color([255, 255, 0, 0.25])
);
var circle;
// When the map is clicked create a buffer around the click point of the specified distance
window.mapClickEvt = on.pausable(map, "click", function(evt){
circle = new Circle({
center: evt.mapPoint,
geodesic: true,
radius: 1,
radiusUnit: "esriMiles"
});
map.graphics.clear();
var graphic = new Graphic(circle, circleSymb);
map.graphics.add(graphic);
var query = new Query();
query.geometry = circle.getExtent();
// Use a fast bounding box query. It will only go to the server if bounding box is outside of the visible map.
fl.queryFeatures(query, selectInBuffer);
});
function selectInBuffer(response){
var feature;
var features = response.features;
var inBuffer = [];
// Filter out features that are not actually in buffer, since we got all points in the buffer's bounding box
for (var i = 0; i < features.length; i++) {
feature = features[i];
if(circle.contains(feature.geometry)){
inBuffer.push(feature.attributes[fl.objectIdField]);
}
}
var query = new Query();
query.objectIds = inBuffer;
// Use an objectIds selection query (should not need to go to the server)
fl.selectFeatures(query, FeatureLayer.SELECTION_NEW, function(features){
var data = array.map(features, function(feature) {
return {
// property names used here match those used when creating the dgrid
"id": feature.attributes[window.outFields[0]],
"popuplation": feature.attributes[window.outFields[1]],
"households": feature.attributes[window.outFields[2]],
"houseunits": feature.attributes[window.outFields[3]]
};
});
var memStore = new Memory({
data: data
});
window.grid.set("store", memStore);
});
}
map.on("load", function(evt) {
// show the border container now that the dijits
// are rendered and the map has loaded
domStyle.set(registry.byId("container").domNode, "visibility", "visible");
});
// fires when a row in the dgrid is clicked
function selectBlkPnt(e) {
map.graphics.clear();
var fl = map.getLayer("blockPnts");
var query = new Query();
query.objectIds = [parseInt(e.target.innerHTML, 10)];
query.returnGeometry=true;
fl.queryFeatures(query, function(results){
var gra = results.features[0].clone();
var symbol = new SimpleMarkerSymbol(
SimpleMarkerSymbol.STYLE_CIRCLE,
12,
new SimpleLineSymbol(
SimpleLineSymbol.STYLE_NULL,
new Color([247, 247, 0, 1]),
1
),
new Color([247, 247, 0, 0.9])
);
gra.setSymbol(symbol);
map.graphics.add(gra);
});
}
// fires when a feature on the map is clicked
function selectGrid(e) {
var id = e.graphic.attributes.OBJECTID;
// select the corresponding row in the grid
// and make sure it is in view
grid.clearSelection();
grid.select(id);
grid.row(id).element.scrollIntoView();
}
});
</script>
</head>
<body class="tundra">
<div id="container" data-dojo-type="dijit/layout/BorderContainer" data-dojo-props="design: 'headline', gutters: false">
<div id="map" data-dojo-type="dijit/layout/ContentPane" data-dojo-props="region: 'center'"></div>
<div id="bottomPane" data-dojo-type="dijit/layout/ContentPane" data-dojo-props="region: 'bottom'">
<div id="grid"></div>
</div>
</div>
</body>
</html>
- Mark as New
- Bookmark
- Subscribe
- Mute
- Subscribe to RSS Feed
- Permalink
Jay,
This sample sounds like what you are looking for:
https://developers.arcgis.com/javascript/3/sandbox/sandbox.html?sample=fl_dgrid
- Mark as New
- Bookmark
- Subscribe
- Mute
- Subscribe to RSS Feed
- Permalink
Yea thats sort of what I want....although I want to click an area, draw a buffer and then select the features within the buffer and return those results to the table. might have to piece a few examples together...just wondering if there was a simple one layer example there already
maybe simply passing the selected features to the query fro the table?
- Mark as New
- Bookmark
- Subscribe
- Mute
- Subscribe to RSS Feed
- Permalink
Jay,
There is not going to be sample for everything you want to do sometimes you have to merge two samples like this then.
<!DOCTYPE html>
<html>
<head>
<meta charset="utf-8">
<meta name="viewport" content="initial-scale=1, maximum-scale=1,user-scalable=no">
<title>Map with a Dojo dGrid</title>
<link rel="stylesheet" href="http://js.arcgis.com/3.25/dojo/resources/dojo.css">
<link rel="stylesheet" href="http://js.arcgis.com/3.25/dgrid/css/dgrid.css">
<link rel="stylesheet" href="http://js.arcgis.com/3.25/dgrid/css/skins/tundra.css">
<link rel="stylesheet" href="http://js.arcgis.com/3.25/dijit/themes/tundra/tundra.css">
<link rel="stylesheet" href="http://js.arcgis.com/3.25/esri/css/esri.css">
<style>
html,
body {
height: 100%;
width: 100%;
margin: 0;
padding: 0;
overflow: hidden;
}
#container {
height: 100%;
visibility: hidden;
}
#bottomPane {
height: 200px;
}
#grid {
height: 100%;
}
.dgrid {
border: none;
}
.field-id {
cursor: pointer;
}
</style>
<script src="http://js.arcgis.com/3.25/"></script>
<script>
// load dgrid, esri and dojo modules
// create the grid and the map
// then parse the dijit layout dijits
require([
"dgrid/OnDemandGrid",
"dgrid/Selection",
"dojo/store/Memory",
"dojo/_base/array",
"dojo/dom-style",
"dijit/registry",
"esri/map",
"esri/layers/FeatureLayer",
"esri/symbols/SimpleMarkerSymbol",
"esri/symbols/SimpleLineSymbol",
"esri/symbols/SimpleFillSymbol",
"esri/Color",
"esri/renderers/SimpleRenderer",
"esri/tasks/QueryTask",
"esri/tasks/query",
"esri/geometry/Circle",
"esri/graphic",
"esri/dijit/PopupTemplate",
"esri/InfoTemplate",
"dojo/_base/declare",
"dojo/number",
"dojo/on",
"dojo/_base/lang",
"dojo/parser",
"dijit/layout/BorderContainer",
"dijit/layout/ContentPane",
"dojo/domReady!"
], function(
Grid,
Selection,
Memory,
array,
domStyle,
registry,
Map,
FeatureLayer,
SimpleMarkerSymbol,
SimpleLineSymbol,
SimpleFillSymbol,
Color,
SimpleRenderer,
QueryTask,
Query,
Circle,
Graphic,
PopupTemplate,
InfoTemplate,
declare,
dojoNum,
on,
lang,
parser
) {
parser.parse();
// create the dgrid
window.grid = new(declare([Grid, Selection]))({
// use Infinity so that all data is available in the grid
bufferRows: Infinity,
columns: {
"id": "ID",
"popuplation": {
"label": "2000 Population",
"formatter": dojoNum.format
},
"households": "Households",
"houseunits": "House Units"
}
}, "grid");
// add a click listener on the ID column
grid.on(".field-id:click", selectBlkPnt);
window.map = new Map("map", {
basemap: "streets",
center: [-95.249, 38.954],
zoom: 14,
});
window.blockUrl = "https://sampleserver6.arcgisonline.com/arcgis/rest/services/Census/MapServer/0";
window.outFields = ["OBJECTID", "POP2000", "HOUSEHOLDS", "HSE_UNITS"];
var fl = new FeatureLayer(window.blockUrl,{
id: "blockPnts",
outFields: ["*"]
});
// Selection symbol used to draw the selected census block points within the buffer polygon
var symbol = new SimpleMarkerSymbol(
SimpleMarkerSymbol.STYLE_CIRCLE,
12,
new SimpleLineSymbol(
SimpleLineSymbol.STYLE_NULL,
new Color([247, 34, 101, 0.9]),
1
),
new Color([207, 34, 171, 0.5])
);
fl.setSelectionSymbol(symbol);
// Make unselected features invisible
var nullSymbol = new SimpleMarkerSymbol().setSize(0);
fl.setRenderer(new SimpleRenderer(nullSymbol));
fl.on("click", selectGrid);
// change cursor to indicate features are click-able
fl.on("mouse-over", function() {
window.mapClickEvt.pause();
map.setMapCursor("pointer");
});
fl.on("mouse-out", function() {
setTimeout(function(){
window.mapClickEvt.resume();
}, 800);
map.setMapCursor("default");
});
map.addLayer(fl);
var circleSymb = new SimpleFillSymbol(
SimpleFillSymbol.STYLE_NULL,
new SimpleLineSymbol(
SimpleLineSymbol.STYLE_SHORTDASHDOTDOT,
new Color([105, 105, 105]),
2
), new Color([255, 255, 0, 0.25])
);
var circle;
// When the map is clicked create a buffer around the click point of the specified distance
window.mapClickEvt = on.pausable(map, "click", function(evt){
circle = new Circle({
center: evt.mapPoint,
geodesic: true,
radius: 1,
radiusUnit: "esriMiles"
});
map.graphics.clear();
var graphic = new Graphic(circle, circleSymb);
map.graphics.add(graphic);
var query = new Query();
query.geometry = circle.getExtent();
// Use a fast bounding box query. It will only go to the server if bounding box is outside of the visible map.
fl.queryFeatures(query, selectInBuffer);
});
function selectInBuffer(response){
var feature;
var features = response.features;
var inBuffer = [];
// Filter out features that are not actually in buffer, since we got all points in the buffer's bounding box
for (var i = 0; i < features.length; i++) {
feature = features[i];
if(circle.contains(feature.geometry)){
inBuffer.push(feature.attributes[fl.objectIdField]);
}
}
var query = new Query();
query.objectIds = inBuffer;
// Use an objectIds selection query (should not need to go to the server)
fl.selectFeatures(query, FeatureLayer.SELECTION_NEW, function(features){
var data = array.map(features, function(feature) {
return {
// property names used here match those used when creating the dgrid
"id": feature.attributes[window.outFields[0]],
"popuplation": feature.attributes[window.outFields[1]],
"households": feature.attributes[window.outFields[2]],
"houseunits": feature.attributes[window.outFields[3]]
};
});
var memStore = new Memory({
data: data
});
window.grid.set("store", memStore);
});
}
map.on("load", function(evt) {
// show the border container now that the dijits
// are rendered and the map has loaded
domStyle.set(registry.byId("container").domNode, "visibility", "visible");
});
// fires when a row in the dgrid is clicked
function selectBlkPnt(e) {
map.graphics.clear();
var fl = map.getLayer("blockPnts");
var query = new Query();
query.objectIds = [parseInt(e.target.innerHTML, 10)];
query.returnGeometry=true;
fl.queryFeatures(query, function(results){
var gra = results.features[0].clone();
var symbol = new SimpleMarkerSymbol(
SimpleMarkerSymbol.STYLE_CIRCLE,
12,
new SimpleLineSymbol(
SimpleLineSymbol.STYLE_NULL,
new Color([247, 247, 0, 1]),
1
),
new Color([247, 247, 0, 0.9])
);
gra.setSymbol(symbol);
map.graphics.add(gra);
});
}
// fires when a feature on the map is clicked
function selectGrid(e) {
var id = e.graphic.attributes.OBJECTID;
// select the corresponding row in the grid
// and make sure it is in view
grid.clearSelection();
grid.select(id);
grid.row(id).element.scrollIntoView();
}
});
</script>
</head>
<body class="tundra">
<div id="container" data-dojo-type="dijit/layout/BorderContainer" data-dojo-props="design: 'headline', gutters: false">
<div id="map" data-dojo-type="dijit/layout/ContentPane" data-dojo-props="region: 'center'"></div>
<div id="bottomPane" data-dojo-type="dijit/layout/ContentPane" data-dojo-props="region: 'bottom'">
<div id="grid"></div>
</div>
</div>
</body>
</html>
- Mark as New
- Bookmark
- Subscribe
- Mute
- Subscribe to RSS Feed
- Permalink
I was just merging two examples and then checked this....cool to see I was on the correct path and solution...
I was literally just merging the below that you referenced above
THANK YOU FOR YOUR HELP and conformation.....
 var data = array.map(features, function(feature) {
 return {
    // property names used here match those used when creating the dgrid
    "id": feature.attributes[WMAoutFields[0]],
    "TYPE": feature.attributes[WMAoutFields[1]],
    "WMA": feature.attributes[WMAoutFields[2]],
    "FG_Symbol": feature.attributes[WMAoutFields[3]]
    };
 });
 var memStore = new Memory({
    data: data
    });
 grid.set("store", memStore);
- Mark as New
- Bookmark
- Subscribe
- Mute
- Subscribe to RSS Feed
- Permalink
Don't forget to mark this question as answered by clicking on the "Mark Correct" link on the reply that answered your question.
- Mark as New
- Bookmark
- Subscribe
- Mute
- Subscribe to RSS Feed
- Permalink
Pretty puzzled...Can only get index 0 and 1 to return results....grid names same as code above, values exist in these fields...hmmmmm But for another day.
- Mark as New
- Bookmark
- Subscribe
- Mute
- Subscribe to RSS Feed
- Permalink
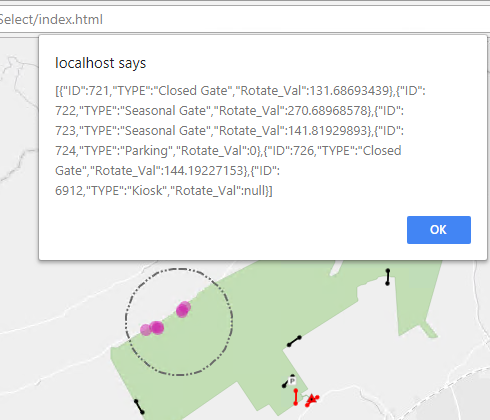
I am really perplexed....It appears that attributes are not being pushed into the buffer...I am definin 6 attributes and have those set in the outfields.....onyl 3 are bein pushed to the alert I set up
When do this : alert(JSON.stringify(data));
I get this: missing attributes...0, 2 and 4 are coming through - 3, 5, and 6 are for some reason not coming through
Any thoughts?
var grid = new (declare([Grid, Selection]))({
bufferRows: Infinity,
loadingMessage: 'Loading data...',
noDataMessage: 'No results found.',
subRows:[
[
{field:"ID", label: "ID", rowSpan: 2},
{field:"TYPE", label: "TYPE"},
{field:"WMA", label: "WMA" }
],
[
{field:"Rotate_Val", label: "Rotate_Val"},
{field:"FG_Symbol", label: "FG_Symbol"},
{field:"Lat", label: "Lat"}
]
]
}, "grid");
grid.on(".field-ID:click", selectState);
// SNIP
WMAUrl = "https://xxxx/arcgis/rest/services/Projects/Locations/MapServer/2"";
outFields2 = ["OBJECTID", "ID", "TYPE", "WMA", "Rotate_Val", "FG_Symbol ", "Lat"]
var featureLayer = new FeatureLayer("https://xxxx/arcgis/rest/services/Projects/Locations/MapServer/2", {
id: "WMAs",
mode: FeatureLayer.MODE_SNAPSHOT,
outfields: ["*"],
visible: true
});
//SNIP
map.on("click", function(evt){
circle = new Circle({
center: evt.mapPoint,
geodesic: true,
radius: 1,
radiusUnit: "esriMiles"
});
map.graphics.clear();
var graphic = new Graphic(circle, circleSymb);
map.graphics.add(graphic);
var query = new Query();
query.geometry = circle.getExtent();
// Use a fast bounding box query. It will only go to the server if bounding box is outside of the visible map.
featureLayer.queryFeatures(query, selectInBuffer);
});
function selectInBuffer(response){
var feature;
var features = response.features;
var inBuffer = [];
// Filter out features that are not actually in buffer, since we got all points in the buffer's bounding box
for (var i = 0; i < features.length; i++) {
feature = features[i];
if(circle.contains(feature.geometry)){
inBuffer.push(feature.attributes[featureLayer.objectIdField]);
}
}
var query = new Query();
query.objectIds = inBuffer;
// Use an objectIds selection query (should not need to go to the server)
featureLayer.selectFeatures(query, FeatureLayer.SELECTION_NEW, function(results){
var data = array.map(features, function(feature) {
return {
// property names used here match those used when creating the dgrid
"ID": feature.attributes[outFields2[0]],
"TYPE": feature.attributes[outFields2[2]],
"WMA": feature.attributes[outFields2[3]],
"Rotate_Val": feature.attributes[outFields2[4]],
"FG_Symbol": feature.attributes[outFields2[5]],
"Lat": feature.attributes[outFields2[6]]
};
});
alert(JSON.stringify(data));
var memStore = new Memory({
data: data
});
grid.set("store", memStore);
});
}
- Mark as New
- Bookmark
- Subscribe
- Mute
- Subscribe to RSS Feed
- Permalink
OK I added my data calls into your example and it works....have to go back and figure out why my code is not working....considered this solved...
- Mark as New
- Bookmark
- Subscribe
- Mute
- Subscribe to RSS Feed
- Permalink
I do have one last question..I posted it in this area because it directly deals with my past issues above....while it is working.....I changed this to a line feature and assume that the selection symbology has to be modified to render the line...have issues with that.
If I dont put this code in there to mark the unseelected as O width the lines draw. NO big deal
// Make unselected features invisible
var nullSymbol = new SimpleLineSymbol().setWidth(0);
linefl.setRenderer(new SimpleRenderer(nullSymbol));When I click in the map the features are returned and displayed in the dGrid. Great
When I click on a record the grid the feature highlights on the map. Great
My issue is when I click the map and the features are selected they are supposed to turn a purpleish color.
This worked for the points but I think I have something wrong with the lines...I have interaction between the grid and map, the features are being selected but the selected features are not rendering in the map for some reason....the only thing I can think of is a bad symbology definition.
window.grid2 = new(declare([Grid, Selection]))({
// use Infinity so that all data is available in the grid
bufferRows: Infinity,
subRows:[
[
{field:"id", label: "ID", rowSpan: 2},
{field:"TYPE", label: "type"},
{field:"WMA", label: "wma" }
],
[
{field:"Label", label: "Label"},
{field:"Name", label: "Name"}
]
]
}, "grid2");
// add a click listener on the ID column
grid2.on(".field-id:click", selectLines);
//-------SNIP---------------------------------------------------------------------
window.LineUrl = "https://xxxxxx/arcgis/rest/services/Projects/Locations/FeatureServer/4";
window.LineoutFields = ["OBJECTID", "ID", "Type", "WMA", "Label", "Name"];
var linefl = new FeatureLayer(window.LineUrl,{
id: "LinePnts",
outFields: ["*"]
});
// Selection symbol used to draw the selected lines
var symbol = new SimpleLineSymbol(
SimpleLineSymbol.STYLE_Solid,
3,
new SimpleLineSymbol(
SimpleLineSymbol.STYLE_NULL,
new Color([247, 34, 101, 0.9]),
1
),
new Color([207, 34, 171, 0.5])
);
linefl.setSelectionSymbol(symbol);
// Make unselected features invisible
var nullSymbol = new SimpleLineSymbol().setWidth(0);
linefl.setRenderer(new SimpleRenderer(nullSymbol));
linefl.on("click", selectlinefl);
// change cursor to indicate features are click-able
linefl.on("mouse-over", function() {
window.mapClickEvt.pause();
map.setMapCursor("pointer");
});
linefl.on("mouse-out", function() {
setTimeout(function(){
window.mapClickEvt.resume();
}, 800);
map.setMapCursor("default");
});
map.addLayer(linefl);
//-------SNIP - ---------------------------------------------------------------------
function selectInBufferLines(response){
alert("SelectInBufferLines");
var feature;
var features = response.features;
var inBuffer = [];
// Filter out features that are not actually in buffer, since we got all points in the buffer's bounding box
for (var i = 0; i < features.length; i++) {
feature = features[i];
if(circle.contains(feature.geometry)){
inBuffer.push(feature.attributes[linefl.objectIdField]);
}
}
var query = new Query();
query.objectIds = inBuffer;
// Use an objectIds selection query (should not need to go to the server)
linefl.selectFeatures(query, FeatureLayer.SELECTION_NEW, function(features2){
var data = array.map(features, function(feature) {
return {
// property names used here match those used when creating the dgrid
"id": feature.attributes[LineoutFields[0]],
"TYPE": feature.attributes[LineoutFields[2]],
"WMA": feature.attributes[LineoutFields[3]],
"Label": feature.attributes[LineoutFields[4]],
"Name": feature.attributes[LineoutFields[5]]
};
});
alert(JSON.stringify(data));
var memStore = new Memory({
data: data
});
grid2.set("store", memStore);
});
}
// fires when a row in the dgrid is clicked
function selectLines(e) {
map.graphics.clear();
var fl2 = map.getLayer("LinePnts");
var query = new Query();
query.objectIds = [parseInt(e.target.innerHTML, 10)];
query.returnGeometry=true;
fl2.queryFeatures(query, function(results){
var gra = results.features[0].clone();
var symbol = new SimpleLineSymbol(
SimpleLineSymbol.STYLE_SOLID,
new Color([247,247,0,.9]),
5
);
gra.setSymbol(symbol);
map.graphics.add(gra);
});
}
// fires when a feature on the map is clicked
function selectlinefl(e) {
var id = e.graphic.attributes.OBJECTID;
// select the corresponding row in the grid
// and make sure it is in view
grid2.clearSelection();
grid2.select(id);
grid2.row(id).element.scrollIntoView();
}