- Home
- :
- All Communities
- :
- Developers
- :
- JavaScript Maps SDK
- :
- JavaScript Maps SDK Questions
- :
- Populate Grid - flip rows and columns
- Subscribe to RSS Feed
- Mark Topic as New
- Mark Topic as Read
- Float this Topic for Current User
- Bookmark
- Subscribe
- Mute
- Printer Friendly Page
- Mark as New
- Bookmark
- Subscribe
- Mute
- Subscribe to RSS Feed
- Permalink
I have two years' worth of county based demographic statistics.
I have the same information for each year. For example: totalPopulation, PopulationOver18, Population17_44, Population45_64 etc
On a map click event for the county layer, I've been asked to display it with years for the columns and rows for the population breakouts, This format is my question.
I typically use dGrid. It seems like I can manipulate the data prior to populating it, but I can't quite wrap my brain around how to go about this.
Example:
COUNTY NAME
| Statistic | Year 1 | Year2 |
|---|---|---|
| Total Population | 123 | 145 |
| Population Over 18 | 56 | 66 |
I don't know if this is a true pivot table, or if this is just a 'turning data on it's head' sort of format.
Solved! Go to Solution.
Accepted Solutions
- Mark as New
- Bookmark
- Subscribe
- Mute
- Subscribe to RSS Feed
- Permalink
Got it! I switched to grid.renderArray, as opposed to Memory. It should work for my purposes.
<!DOCTYPE html>
  <html>
  <head>
    <meta http-equiv="Content-Type" content="text/html; charset=utf-8">
    <meta http-equiv="X-UA-Compatible" content="IE=7, IE=9, IE=10">
    <meta name="viewport" content="initial-scale=1, maximum-scale=1,user-scalable=no"/>
    <title>Populate Grid from My Arrays</title>
    <link rel="stylesheet" href="https://js.arcgis.com/3.13/dijit/themes/claro/claro.css"/>
    <link rel="stylesheet" type="text/css" href="https://js.arcgis.com/3.13/esri/css/esri.css"/>


<script type="text/javascript">
var dojoConfig = {
  parseOnLoad: false,
  async:true
};
</script>
<script type="text/javascript" src="https://js.arcgis.com/3.13compact/"></script>
</head>
<body class="claro">
      <script type="text/javascript">
        require([
        "dojo/on",
        "dojo/parser",
        "dojo/_base/array",
        "dgrid/Grid",
        "dojo/domReady!"
  ], function(
  on, parser,arrayUtils, Grid ) {
        var cols = {fieldName: "Field",val2015:"2015",val2030:"2030"}
        var fields=["Total","Age17_44","Age45_64","Age65_84", "Age85plus"]
        var valCurrent= [1000, 200, 300, 450,350];
        var valEst = [500, 100,200,150, 50]
        var outputArr = [];
          for (index = 0; index < valCurrent.length; index++) {
            var rowObj = {
              fieldName:fields[index],
              val2015:valCurrent[index],
              val2030:valEst[index]
            };
            outputArr.push(rowObj)
          };
      var grid = new Grid({
        columns:cols
        }, "outputGrid");
        grid.renderArray(outputArr);
        grid.startup();
});
     </script>
        <div id="outputGrid">
      </div>
    </body>
</html>
- Mark as New
- Bookmark
- Subscribe
- Mute
- Subscribe to RSS Feed
- Permalink
Tracy,
I think I understand what you are asking.
You want a way to show in the table the population that is under 18 over 18 but below 50 and so on?
If so what does your data look like?
- Mark as New
- Bookmark
- Subscribe
- Mute
- Subscribe to RSS Feed
- Permalink
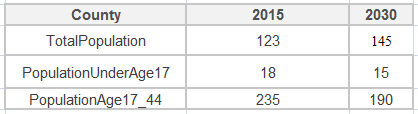
Not really, no. This is the kind of data I have and typically you would show you data like this:
| Field | Value |
|---|---|
| County | Cooper |
| TotalPopulation2015 | 123 |
| TotalPopulation2030 | 145 |
| 2015_PopulationUnderAge17 | 18 |
| 2030_PopulationUnderAge17 | 15 |
| 2015__PopulationAge17_44 | 235 |
| 2030_PopulationAge_17_44 | 190 |
The question is how I can change this format to something more like I showed in my original post.
- Mark as New
- Bookmark
- Subscribe
- Mute
- Subscribe to RSS Feed
- Permalink
Are you opposed to making a new layer?
If not do something like this:
If you are I am not sure how to manipulate the data in Javascript.
- Mark as New
- Bookmark
- Subscribe
- Mute
- Subscribe to RSS Feed
- Permalink
Obviously you have 2 columns for the years but how many rows are we talking? You might as well create an HTML table & use SPAN tags w/ IDs to just populate the table using element.innerHTML() once you have a map click event. & access to the data values A pain in the butt to initially code but it would work.
- Mark as New
- Bookmark
- Subscribe
- Mute
- Subscribe to RSS Feed
- Permalink
The client isn't quite certain about the final rows, but I'd say around a dozen, tops. I thought about making a plain table, especially since the output format is nothing like how the data will be stored in a table. Makes it tough to have meaningful events associated with it.
I've used row Renderers before. I wonder if I could take advantage of that to build a table. Generally I'm making something that looks like a paragraph with divs, but I guess there's no reason why it couldn't be a table instead as long as I had the HTML format right.
- Mark as New
- Bookmark
- Subscribe
- Mute
- Subscribe to RSS Feed
- Permalink
HTML Table template:
<table border="1"  cellpadding="3" cellspacing="3">
  <tr>
  <td>County:</td>
  <td>2015</td>
  <td>2030</td>
  </tr>
  <tr>
  <td>Total Population:</td>
  <td><span id="lblPop2015"></span></td>
  <td><span id="lblPop2030"></span></td>
  </tr>
  <tr>
  <td>Population Under 17:</td>
  <td><span id="lblPopUnder17_2015"></span></td>
  <td><span id="lblPopUnder17_2030"</span></td>
  </tr>
  <tr>
  <td>Population 17-44:</td>
  <td><span id="lblPop17_44_2015"></span></td>
  <td><span id="lblPop17_44_2030"></span></td>
  </tr>
</table>
JS:
countyLayer.on("click", function(evt) {
    fullAttrib = evt.attributes;

    document.getElementById("lblPop2015").innerHTML = fullAttrib.TotalPopulation2015;
    document.getElementById("lblPop2030").innerHTML = fullAttrib.TotalPopulation2030;
    document.getElementById("lblPopUnder17_2015").innerHTML = fullAttrib.2015_PopulationUnderAge17;
    document.getElementById("lblPopUnder17_2030").innerHTML = fullAttrib.2030_PopulationUnderAge17;
    //etc etc etc
});
- Mark as New
- Bookmark
- Subscribe
- Mute
- Subscribe to RSS Feed
- Permalink
AAAARRRRGGGGHHHH. I *HATE* this stinking forum software.
My HTML got eaten up. Here's a screenshot of what it SHOULD have looked like:

- Mark as New
- Bookmark
- Subscribe
- Mute
- Subscribe to RSS Feed
- Permalink
It seems like there's been issues with the forum the past couple of days. Yesterday I wasn't able to reply to any thread until the end of the day and this AM it was just down.
I'm going to give that a try, along with my renderRow idea. It seems like I might be able to stuff some of this into an array of fields names and step through it that way. It would save hard coding all those fields. If I have to do it that way, it would be manageable, but tedious. I haven't tried to manipulate the output of the QueryTask with SQL, but then I've never needed to before.
Right now, this is largely a theoretical question. I don't have the services started up yet to code against while we finalize the specs for this project. I'll have to remember to come back later and update this post. I just hate to tell a customer that something is possible, when I've never done it before.
- Mark as New
- Bookmark
- Subscribe
- Mute
- Subscribe to RSS Feed
- Permalink
My only other random thought was if you could use a SQL query to craft the response from your queryTask in the format you want. I know ESRI typically says "any standard SQL query" works but we all know that's not true..