- Home
- :
- All Communities
- :
- Developers
- :
- Python
- :
- Python Questions
- :
- Re: Correlation between rainfall and temperature a...
- Subscribe to RSS Feed
- Mark Topic as New
- Mark Topic as Read
- Float this Topic for Current User
- Bookmark
- Subscribe
- Mute
- Printer Friendly Page
Correlation between rainfall and temperature anomaly in Python
- Mark as New
- Bookmark
- Subscribe
- Mute
- Subscribe to RSS Feed
- Permalink
This question has been branched from this question: https://community.esri.com/thread/198969-trend-analysis-through-time-series-of-raster-data to give it more visibility
Dear Xander Bakker and Dan Patterson thank you for the awesome discussion.
I have different case. Let say I have raster timeseries for monthly rainfall anomaly data from 1981-2017 for 1 province. And then I have sea surface temperature anomaly data for the same periods and from 1 location only (text data).
I want to see the correlation between both data (rainfall and temperature anomaly) for each pixel in raster data. Is it possible to do this using above script? I want to have sets of raster (slope, intercept, r value, p value and std error) as an output.
From this output I hope I can see if the temperature increase in the Pacific, which area will experience more/less rainfall.
Thanks, Benny
- Mark as New
- Bookmark
- Subscribe
- Mute
- Subscribe to RSS Feed
- Permalink
Hi Benny Istanto ,
If I understand correctly you have a single location with sea surface temperature anomaly data that should be related to every pixel of each raster. Does the location represent each pixel in the raster? Should a certain distance be considered for the raster to have a correlation with the sea surface location?
- Mark as New
- Bookmark
- Subscribe
- Mute
- Subscribe to RSS Feed
- Permalink
Hi Xander Bakker,
Sorry for late reply, I tried to prepared the data and example to better understand the process and output that I want to achieve.
So this is two different data and the correlation is not based on the distance. I will explain more details below.
I would like to see general sensitivity of rainfall in a country to sea surface temperature (SST) changes of NINO-3.4 region in Pacific. Why Pacific? Because this region is optimal for monitoring El Nino-Southern Oscillation and its impacts in Southeast Asia.
Simple regression equation is applied to indicate the correlation between rainfall anomaly in each area to anomaly of SST in Pacific Ocean which represent ENSO signals.
Y = a + bX, where:
Y = Rainfall anomaly
a = Y intercept
b = Slope
X = SST anomaly
From this approach (in this case, I used Timor-Leste as an example) and the map, we can say Timor-Leste is heavily affected by El Niño which is associated with a rise in SST, negatively impacting rainfall in much of the country.
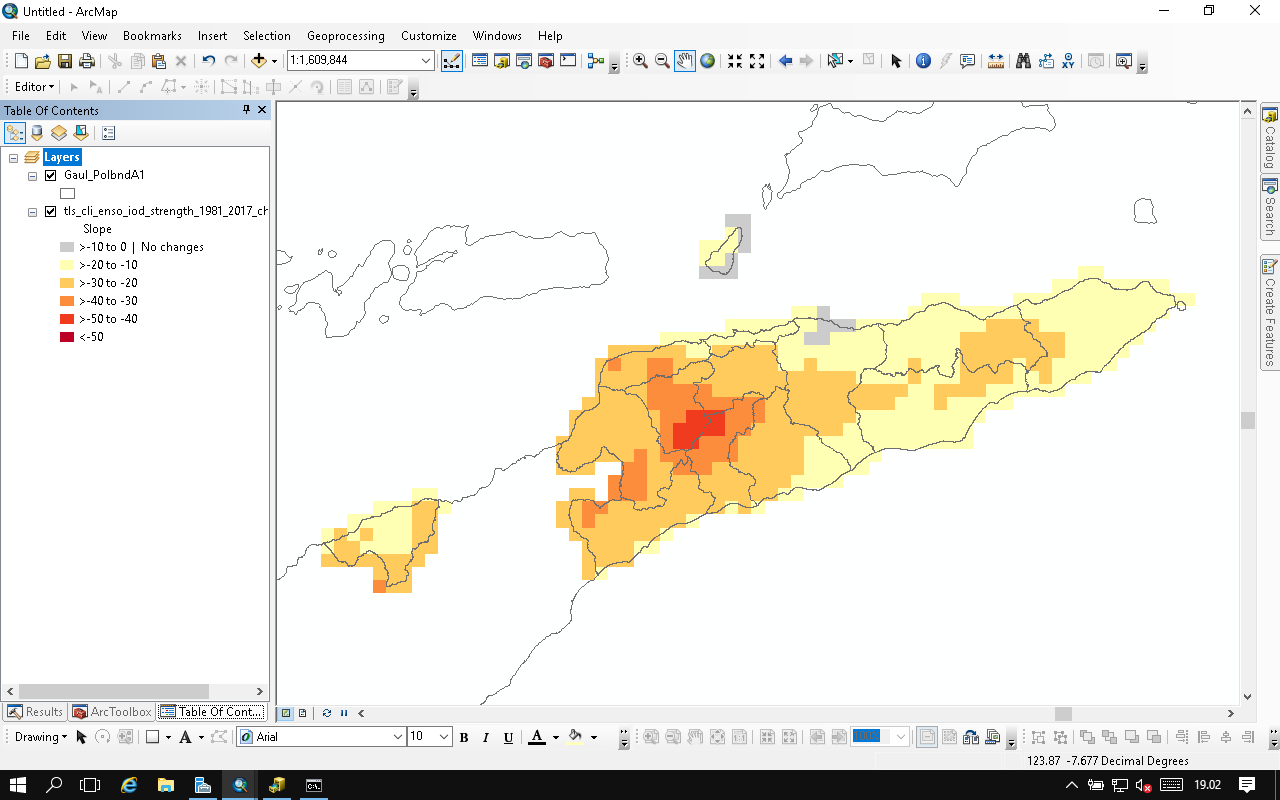
To get the map, I tried manual process using spreadsheet - precip_sst_regression.xlsx , I convert monthly rainfall anomaly raster data - tls_precip_anomaly.zip to csv and calculate the regression between rainfall anomaly and SST anomaly - sst_anom.csv
I hope this help and how to use your script above in my case?
- Mark as New
- Bookmark
- Subscribe
- Mute
- Subscribe to RSS Feed
- Permalink
Hi Benny Istanto ,
Thanks for the additional explanation and sharing the data. This will take some time to analyze. I just came back from Dallas (GeoConX) and next week I will be at our Ecuador office, so it might take some time before I can provide a useful answer, but I will definitely look into it.
- Mark as New
- Bookmark
- Subscribe
- Mute
- Subscribe to RSS Feed
- Permalink
Hi Xander Bakker
I have tried to simplify the input data. See attached: rainfall anomaly and sst anomaly
Both folder (rainfall and sst) have 444 geotiff. For SST, I have created constant raster, and its have same dimension with rainfall anomaly, the value is following data in sst_anom.csv in my previous answer.
Using your script in the different thread, how to do pixel-wise regression between two sets of raster timeseries?
- Mark as New
- Bookmark
- Subscribe
- Mute
- Subscribe to RSS Feed
- Permalink
Hi Benny Istanto ,
Thanks for sharing the simplified data. I haven't had the time to look into it, since it is a "little" hectic here at the end of the year, but I haven't forgotten about it. I dowwloaded the data and will start soon to give it a try. Thanks for your patience.
I'm not sure if a regression based on two values will yield a good result, but I would have to look into this to see what the result will be.
As you can see in the "other" thread (https://community.esri.com/thread/198969-trend-analysis-through-time-series-of-raster-data#comment-7... ) you can access the raster(s) with arcpy.RasterToNumPyArray(ras_path), get the number of rows and columns using the shape of the array like this:
rows = ras_np.shape[0]
cols = ras_np.shape[1]
Based on this you can create a loop through the rows and columns to access each pixel in multiple rasters (two in your case) and do something with these values and write the result to a new numpy array which will be converted to a raster at the end. I will have to look into the data to see if a regression based on two values makes sense.
- Mark as New
- Bookmark
- Subscribe
- Mute
- Subscribe to RSS Feed
- Permalink
Hi Benny Istanto ,
I gave this some more thought and still come to the conclusion that having 444 regression rasters will make it hard to define a conclusion of the analysis. If the sequence of rasters is indeed a sequence of values through time, maybe it would be better to loop through the 444 raster, on a pixel level determine the difference between the rainanom raster and the corresponding sstanom raster and determine the regression values for the sequence of 444 differences on a pixel level. Does that make sense? With some modifications to the script this should be possible to achieve.