- Home
- :
- All Communities
- :
- Products
- :
- Geoprocessing
- :
- Geoprocessing Questions
- :
- Help with using Geoprocessing task in JS applicati...
- Subscribe to RSS Feed
- Mark Topic as New
- Mark Topic as Read
- Float this Topic for Current User
- Bookmark
- Subscribe
- Mute
- Printer Friendly Page
Help with using Geoprocessing task in JS application
- Mark as New
- Bookmark
- Subscribe
- Mute
- Subscribe to RSS Feed
- Permalink
Hi,
I am working with GP task for the first time and I am having some trouble getting it to work. I have published a synchronous GP service and I am trying to use that in a JS web application.
In my application all I want is a base map and I am using a map click to draw a buffer, with a user defined distance and select all the census block points that fall within that distance and output a summary of total block points, population and housing units within the buffer, I am not using a feature layer to select features or a result map service to draw the selected points on the map, but I want to use GP task to output a summary table.
What I am trying to do is, add the buffer graphics on the map and use it to input GP task result, something like in his sample which is using the user defined polygon to input the GP task, and getting a summary of population for that area.
http://developers.arcgis.com/javascript/sandbox/sandbox.html?sample=gp_zonalstats
The GP task is working fine, because I added This GP task to the geoprocessing widget in the web app builder and it is doing exactly like I want it:

I am having trouble adding it to JS application, here is a JS fiddle with what I have so far but is not working:
This is what JSON from the service looks like:
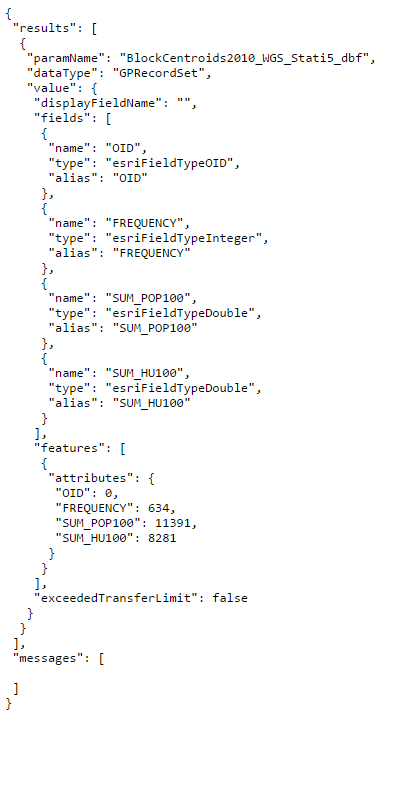
I have also attached the image of the model used to publish the service and the details from the REST service directory.
Any help will be greatly appreciated!!
Solved! Go to Solution.
- Mark as New
- Bookmark
- Subscribe
- Mute
- Subscribe to RSS Feed
- Permalink
Thanks, will do that.
- Mark as New
- Bookmark
- Subscribe
- Mute
- Subscribe to RSS Feed
- Permalink
Here is the relevant JavaScript part of the code from the working sample modified by Owen Earley
You would have to add the URL of the your GP service and input parameter pertaining to your GP service:
    require([
        "esri/map",
        "esri/dijit/Scalebar",
        "esri/dijit/Search",
        "esri/tasks/query",
        "esri/tasks/Geoprocessor",
        "esri/tasks/FeatureSet",
        "esri/tasks/ParameterValue",
        "esri/geometry/Circle",
        "esri/graphic",
        "esri/geometry/webMercatorUtils",
        "esri/symbols/SimpleMarkerSymbol",
        "esri/symbols/SimpleLineSymbol",
        "esri/symbols/SimpleFillSymbol",
        "esri/renderers/SimpleRenderer",
        "esri/SpatialReference",
        "esri/config",
        "dijit/layout/BorderContainer",
        "dijit/layout/ContentPane",
        "esri/Color",
        "dojo/dom",
        "dojo/parser",
        "dojo/on",
        "dojo/dom-style",
        "esri/layers/GraphicsLayer",
        "dojo/domReady!"],
    function (
        Map,
        Scalebar,
        Search,
        Query,
        Geoprocessor,
        FeatureSet,
        ParameterValue,
        Circle,
        Graphic,
        webMercatorUtils,
        SimpleMarkerSymbol,
        SimpleLineSymbol,
        SimpleFillSymbol,
        SimpleRenderer,
        SpatialReference,
        esriConfig,
        BorderContainer,
        ContentPane,
        Color,
        dom,
        parser,
        on,
        domStyle,
        GraphicsLayer) {


    // Parse DOM nodes decorated with the data-dojo-type attribute
    parser.parse();


    //Step: Specify the output fields
    // this should not be needed as nearly all query & select functions are performed on the client
    esriConfig.defaults.io.proxyUrl = "/proxy";


    map = new Map("mapDiv", {
        basemap: "streets",
        center: [-99.249, 31.954],
        zoom: 7,
        slider: true
    });

    var s = new Search({map: map}, "search");
    s.startup();


    var scalebar = new Scalebar({
        map: map,
        scalebarUnit: "dual"
    });

    //Buffer circle symbol  based on user input distance for dispaly only, not used for selecting features
    var circleSymb = new SimpleFillSymbol(SimpleFillSymbol.STYLE_NULL,
                        new SimpleLineSymbol(SimpleLineSymbol.STYLE_SHORTDASHDOTDOT,
                        new Color([105, 105, 105]), 2), new Color([255, 255, 0, 0.25]));


    // GP
    var gpTask = new Geoprocessor("YourGP service URL");
    gpTask.setOutSpatialReference = map.spatialReference;

    // Setup onTaskSuccess and onTaskFailure event handlers.
    dojo.connect(gpTask, "onExecuteComplete", createSummaryTable);
    dojo.connect(gpTask, "onError", createSummaryTableFailed);

    //when the map is clicked create a buffer around the click point of the specified distance.
    map.on("click", function (evt) {

        // Add search radius graphic to map
        var radius = parseInt(dom.byId("bufferDistance").value);
        addRadiusGraphic(evt.mapPoint, radius);

        // Project map point to geographic and send to GP Task
        var ptGeo = webMercatorUtils.webMercatorToGeographic(evt.mapPoint);
        runGpTask(ptGeo, radius)
    });

    function addRadiusGraphic(pt, radius) {
        var circle = new Circle({
            center: pt,
            geodesic: true,
            radius: radius,
            radiusUnit: "esriMiles"
        });
        var graphic = new Graphic(circle, circleSymb);
        map.graphics.clear();
        map.graphics.add(graphic);
    }

    function runGpTask(pt, radius) {
        console.log("Run GP Task: ", pt, radius);

        //pt.attributes["OBJECTID"] = 1;

        var gr = new Graphic(pt);
        gr.setAttributes({"OBJECTID": 1});

        // Create GP task params (input feature set and search distance)
        var inputFeatures = new esri.tasks.FeatureSet();
        inputFeatures.geometryType = "esriGeometryPoint";
        inputFeatures.spatialReference = new SpatialReference(4326);
        inputFeatures.features = [gr];
        var SearchDistance = new esri.tasks.LinearUnit();
        SearchDistance.distance = radius;
        SearchDistance.units = "esriMiles";
        var params = {
            "PointFeatureSet_WGS": inputFeatures,
            "Search_Distance": SearchDistance
        };

         console.log("Execute GP Task: ", params);

        dom.byId("totalsInfo").innerHTML = 'Calculating...';
        // Execute GP task
        gpTask.execute(params);

    }


    function createSummaryTable(results, messages) {
        console.log("createSummaryTable: ", results, messages);

        var recSet = results[0].value;
        var totBlocks = recSet.features.length;

        var totTotalPopulation = 0;
        var totHouseholdUnits = 0;
        for (var x = 0; x < recSet.features.length; x++) {
          totHouseholdUnits += recSet.features.attributes["SUM_HU100"];
          totTotalPopulation += recSet.features.attributes["SUM_POP100"];
        }

        var htmlSummary = '<table id="resultsTable" cellspacing="0">' +
          '<tr><td>Blocks</td><td align="right">' + totBlocks + '</td></tr>' +
          '<tr><td>Total Population</td><td align="right">' + totTotalPopulation + '</td></tr>' +
          '<tr><td>Housing Units</td><td align="right">' + totHouseholdUnits + '</td></tr>' +
          '</table>';
        dom.byId("totalsInfo").innerHTML = htmlSummary;
    }

    function createSummaryTableFailed() {
        dom.byId("totalsInfo").innerHTML = "Processing Error";
    }


    });
Thanks.
- « Previous
-
- 1
- 2
- Next »
- « Previous
-
- 1
- 2
- Next »