- Home
- :
- All Communities
- :
- Products
- :
- Geoprocessing
- :
- Geoprocessing Questions
- :
- Re: Determining the area above a threshold level
- Subscribe to RSS Feed
- Mark Topic as New
- Mark Topic as Read
- Float this Topic for Current User
- Bookmark
- Subscribe
- Mute
- Printer Friendly Page
Determining the area above a threshold level
- Mark as New
- Bookmark
- Subscribe
- Mute
- Subscribe to RSS Feed
- Permalink
I am trying to create a map to identify land that is suitable for growing crops on. I have a raster which displays the yield potential for Europe, but is not divided into countries. I have also calculated the yield potential requirement that is needed to be achieved on the land in each individual country. I calculated this on an excel document but have also added it as a field on a vector layer with country polygons.
Is there a way for me to determine which areas are above the threshold level as the level varies by country?
Sorry if this isn't worded well, I wasn't really sure the best way to explain it.
(I'm using version 10.4.1)
- Mark as New
- Bookmark
- Subscribe
- Mute
- Subscribe to RSS Feed
- Permalink
you haven't indicated whether you have an elevation DEM or other form elevation data.
If you have a DEM, then it is a simple query to delineate areas above a threshold.
If you have the data in a table, then indicate the form and other relevant data
- Mark as New
- Bookmark
- Subscribe
- Mute
- Subscribe to RSS Feed
- Permalink
Sorry I don't think I worded it very well, I don't have any kind of elevation data, by threshold I mean the yield potential that it needs to be above in order for that area to be considered viable to crop.
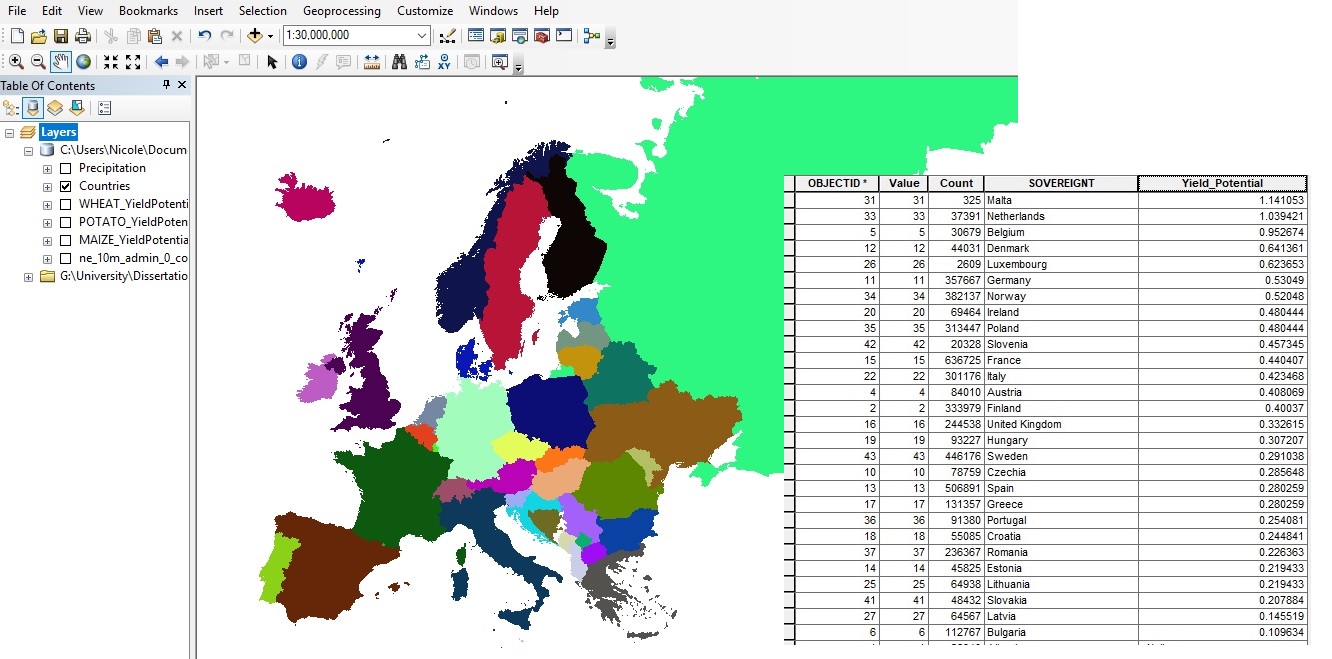
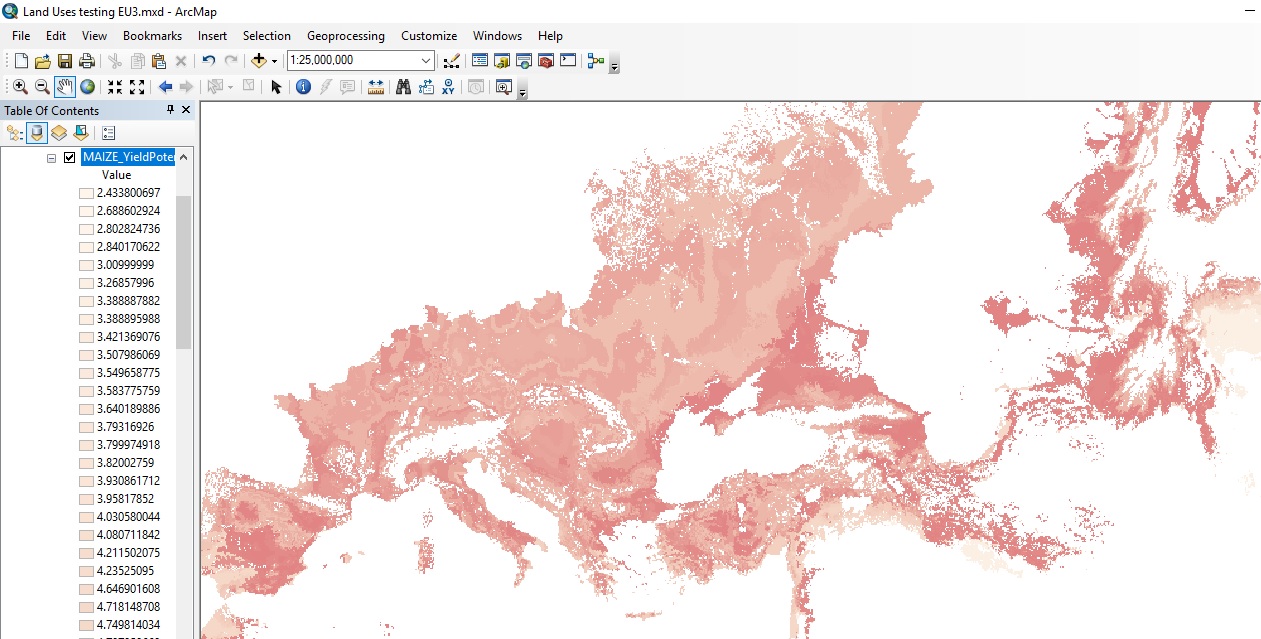
I've added some screenshots to see if that helps explain what I mean better, so I have one layer that is the country layer, and in the attribute table I have the yield potential values that need to be surpassed. Then the other is a raster layer that is shows the yield potential values of Europe. So essentially I need to subtract the values that I have for each country from the values on the other layer.
- Mark as New
- Bookmark
- Subscribe
- Mute
- Subscribe to RSS Feed
- Permalink
You need to convert the upper vector to raster and then subtract using the raster calculator or the Minus tool. Alternately you could do a Zonal Mean using the upper vector as the zones and the raster as the data to summarize. My guess is that you shouldn't produce a false sense of accuracy since the raster data is more generalized, hence averaging the values is better, and you can perform the calculation (difference) with the resultant values in the vector table.
- Mark as New
- Bookmark
- Subscribe
- Mute
- Subscribe to RSS Feed
- Permalink
I had the layer as a raster and was trying to use the raster calculator before but it wasn't doing what I wanted, not 100% sure what I did differently this time around but it finally worked!
Thank you! 
- Mark as New
- Bookmark
- Subscribe
- Mute
- Subscribe to RSS Feed
- Permalink
good! glad it worked