- Home
- :
- All Communities
- :
- Industries
- :
- Education
- :
- Education Blog
- :
- Syllabi for courses and workshops for using Locati...
Syllabi for courses and workshops for using Location Analytics in Higher Education Schools of Business
- Subscribe to RSS Feed
- Mark as New
- Mark as Read
- Bookmark
- Subscribe
- Printer Friendly Page
- Report Inappropriate Content
This selection of syllabi and workshops that use location analytics in higher education schools of business has been created to provide ideas, inspiration, and confidence for business instructors and students. This resource will be updated as additional syllabi and workshop outlines are developed and shared.
Sample University Syllabi
Set of resources from Dr Murray Rice, University of North Texas.
Business Intelligence and Analytics from BYU Idaho.
Workshop Syllabus
The following 10-item syllabus for a short (1 to 3 hour) workshop on location analytics is one that has been tested and used in many university and college settings, for an audience of students, faculty, university administrators, or all of the above. However, the syllabus can be adapted and modified as needed as audience, time available, and needs change.
At the beginning of the workshop, state who you are (as the speaker) and why the audience should listen to you. Provide a background along with an explanation of why you are passionate about location analytics.
1. What challenges are communities and societies confronting from a local to a global scale? Health, energy, water quality and quantity, rapid urbanization, economic inequalities, ecosystem degradation and species loss, climate, natural hazards (floods, hurricanes, wildfires, earthquakes, mudslides, tornadoes, others), sustainable agriculture, vibrant but sensitive tourism, public safety, locating the optimal site for goods or services, and others are global problems that increasingly affect our everyday lives. All of these issues and problems have a location component. Hence, location analytics will increasingly be depended on for smart decision making for a healthier and more sustainable future in government, private industry, nonprofit organizations, and academia?
2. What challenges do businesses regularly confront? Site optimization, understanding consumer behavior, supply chain management, assessing risk, understanding demographic and behavioral trends, corporate security, enhancing company reputation, and many others. All of these issues have a location component. Hence, location analytics are used by all businesses to achieve their corporate and societal goals. One such set of challenges exists during the COVID-19 crisis, as detailed on this operational awareness page about business continuity and recovery.
3. What are the key components comprising Location Analytics? Components include technology, data, and communication instruments.
(3a.) Technological components to Location Analytics: Geographic Information Systems (GIS), web mapping, remote sensing, and Global Navigation Satellite Systems (GNSS)/Global Positioning Systems (GPS). This technological framework for Location Analytics exists increasingly in a cloud-based Software-as-a-Service (SaaS) environment. This framework allows for web mapping applications, such as dashboards and multimedia maps and apps, to be built upon it, shared, and used.
(3b.) Data: Consumer preference, lifestyle, demographics, environmental, location of competitors, suppliers, stores within the same franchise or chain, distributors, and more. All of this data contains a location component, such as street address, latitude-longitude, city-country combination, place name, census enumeration area, or political area from town to country. All of this data exists as either points, lines, polygons, tables, images, or grids. Much of this data is scalable from local to global scale. Much of this data exists as cloud-based Data-as-Services, accessible via ArcGIS Hub sites, open data sites, Business Analyst Web, and libraries such as the ArcGIS Living Atlas of the World.
(3c.) Communication instruments: The output of the work done in Location Analytics is increasingly varied, and ranges from 2D and 3D maps, web mapping applications, tables, charts, dashboards, infographics, and other multi-media visualizations. The boundary between maps and visualizations is increasingly blurred, as the number of tools multiply.
4. List the 10 key messages provided above, or a subset, depending on the needs of the audience and the goals of the speaker.
5. The SaaS environment for tools and spatial data offers several key advantages for today's business students, faculty, and business professionals:
(5a.) The tools can be accessed on any device, anywhere, at any time. This vastly increases the number and diversity of people who have access to use the tools to analyze the data, and people who can view the results.
(5b.) The data available for use in business education mirrors the "big data" movement, increasing in velocity, volume, veracity, and variety. The data arise from a variety of sources, from near-real-time and real-time data feeds, to data from academic institutions, government agencies, private companies, and nonprofit organizations. Much is available aggregated at the neighborhood level. Much data on current information and projected information are updated on a regular basis. Much data is documented in terms of its scale, lineage, source, accuracy, format, permitted uses, and other characteristics as metadata.
(5c.) The tools update on a regular basis. With each update, the tools become easier to use, better documented, and more powerful.
6. Provide several powerful, engaging case studies clearly showing the use cases for who uses location analytics. These include Fruit of the Loom, Starbucks, Esri, Chick Fil A, John Deere, and others. See a selection of videos in the middle of the Business Analyst overview page. For more case studies, see those on the business education landing page and on the Esri industries page.
7. Explain why should the audience should use location analytics: For students, Learning and using Location Analytics adds value to business content knowledge, in marketing, management, risk assessment, and supply chain. Location Analytics adds value in skills such as proximity, routing, choropleth mapping, geocoding, creating infographics, reports, and storymaps.
Location Analytics adds additional skills in presenting, communication, and cartography. For instructors, it helps them to teach core content in more relevant and exciting ways. It helps anyone understand how to work more effectively with data, how to consider change over space and time, how to consider scale in business, how to think critically, and how to solve problems. See this article on addressing the business analyst skills gap in WhereNext.
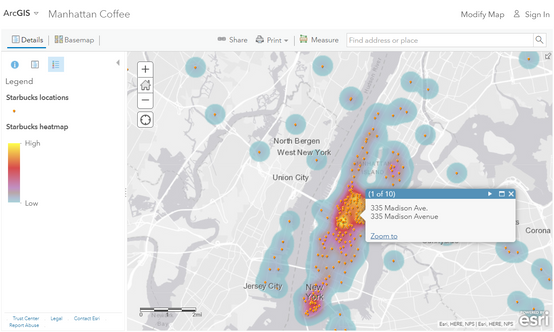
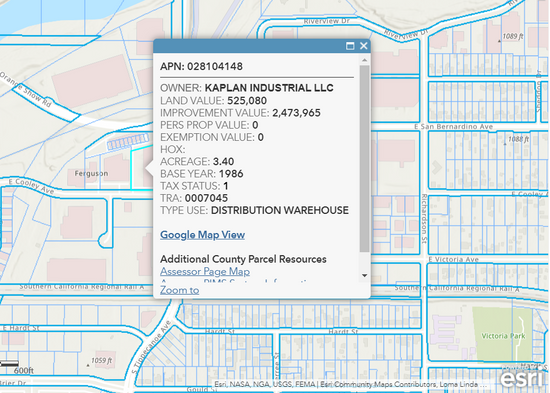
8. Lead a short activity in hands-on mode, in a teaching lab or via a Bring Your Own Device (BYOD) mode in any classroom, or online, using Location Analytics. Use any of the attached activities (at end of this essay) or other resources mentioned on this page. You could begin by comparing two different types of businesses (bail bonds and car washes map in Oklahoma City) or the Starbucks around-the-world "Manhattan Coffee" map in ArcGIS Online, or the San Bernardino County parcels with property values, and then move to an activity that incorporates analytics, such as analyzing convenience store regional chain patterns (attached) or siting a new business.
Images from Starbucks analysis map and property values map in ArcGIS Online.
9. Encourage your audience to dig deeper, given the skills they have just learned and practice, into ArcGIS Online, ArcGIS Insights, or Business Analyst Web (overview of slides attached at the end of this essay) with the data they have been using in the previous step. Start by noting patterns and relationships. Zoom in and zoom out and note how patterns sometimes change as the scale changes. Then change the symbology and classification. Filter the data on different criteria by building expressions. Add additional variables, such as demographics or consumer behavior at different scales and analyze the patterns and relationships. Map competitive businesses and business that aid another business. Then, create reports, infographics, and storymaps, and share your results.
10. End the workshop with a discussion of how the audience can learn more about Location Analytics. Selected key resources are as follows:
(10a.) The resources on the business education landing page.
(10b.) Obtaining an account on www.arcgis.com (via, for example, the university's existing Esri license or via the ArcGIS Developers site).
(10c.) Taking a free, fun, and rigorous Esri MOOC, especially the Location Advantage MOOC that focuses on business.
(10d.) Taking courses and watching webinars on the Esri training site, on analysis tools, field apps and tools, and reporting tools.
(10e.) Learning about Python and Javascript via the tutorials on ArcGIS Developers site. These tutorials show in side-by-side fashion, how the code runs the map. The tutorials ask you to make adjustments in specific lines of code, and there is instant gratification as the map changes when you make these adjustments!
--End--
You must be a registered user to add a comment. If you've already registered, sign in. Otherwise, register and sign in.
-
Administration
38 -
Announcements
45 -
Career & Tech Ed
1 -
Curriculum-Learning Resources
179 -
Education Facilities
24 -
Events
47 -
GeoInquiries
1 -
Higher Education
519 -
Informal Education
266 -
Licensing Best Practices
46 -
National Geographic MapMaker
17 -
Pedagogy and Education Theory
187 -
Schools (K - 12)
282 -
Schools (K-12)
185 -
Spatial data
24 -
STEM
3 -
Students - Higher Education
231 -
Students - K-12 Schools
86 -
Success Stories
22 -
TeacherDesk
1 -
Tech Tips
83
- « Previous
- Next »

