- Home
- :
- All Communities
- :
- Industries
- :
- Education
- :
- Education Blog
- :
- Participatory Mapping with Google Forms, Google Sh...
Participatory Mapping with Google Forms, Google Sheets, and ArcGIS Online
- Subscribe to RSS Feed
- Mark as New
- Mark as Read
- Bookmark
- Subscribe
- Printer Friendly Page
I have been receiving questions from schools that have become "Google Schools" as well as universities and individual researchers who want to use Google Sheets in ArcGIS Online. What are the advantages of using Google Sheets (spreadsheets, really, is what they are) over using an Excel spreadsheet on your own computer? Google Sheets live in the cloud, just like ArcGIS Online, so they can be edited from any device, anywhere, and the author of the Sheet can invite others to add data to it, so they can accept input from multiple collaborators, students, and faculty. Some educators want to map data that they have input into Google Sheets. Others want to go to the next level, where multiple students or researchers edit Google Sheets in a participatory mapping or citizen science environment, and the resulting data is mapped and automatically refreshes as the data continues to be added.
Both of these scenarios are possible with ArcGIS Online. To illustrate, I created a form where students are asked, "What country have you visited?", shown below.
After students fill out the form, I go to the "responses" zone in Google Forms, and access the spreadsheet that is created from the data. Now that my data is in my Google Sheet, I access > File > Publish to the Web > and change "Web Page" to "Comma Separated Values (.csv)" file > Publish.
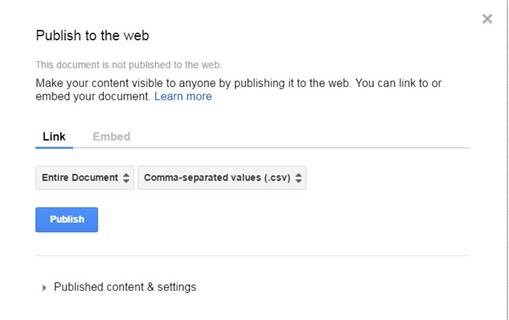
Then, I copy the resulting URL:
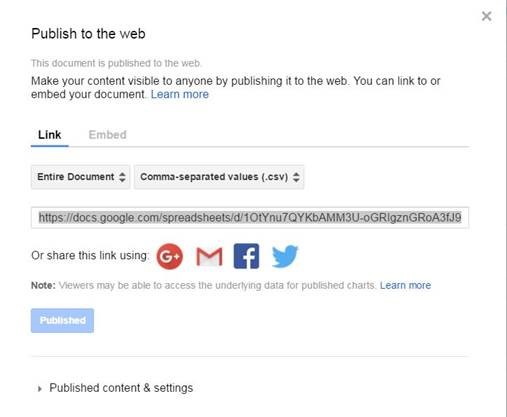
Then, I access my ArcGIS Online account, open a new or existing map > Add > Add Layer from Web - CSV file > paste your URL for my Google Sheet here.
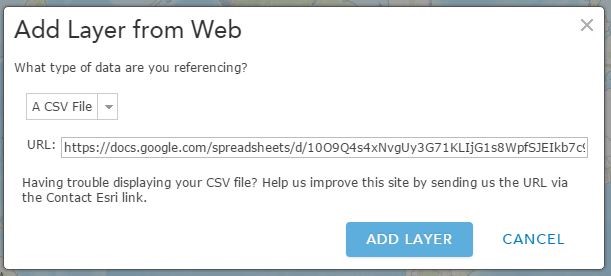
Next, I > Add Layer > I indicate which fields contain my location information (address, latitude-longitude, city/state/country combination).
That's really all there is to it!
My results are in this map linked here, and shown below:
Note that I used one of the fun new basemaps in ArcGIS Online that I wrote about here.
In another example, this time using cities instead of countries, see this map of the 10 most polluted and 10 least polluted large cities of the world. Students examine spatial patterns and reasons for the pollution (or lack of it) in each city using the map and the metadata here. I created this map by populating this Google Sheet, below. My students could add 10 or 20 more to this sheet and their changes would be reflected in my ArcGIS Online map.
Here is the map from the data, below. For those explanatory labels, I used this custom label expression:
$feature.City + " is the #" + " " + $feature.Rank + " " + $feature.Variable and set the text color to match the point symbol color for clarity. For more about expressions, see my blog post here.
In another example, my colleague created this google sheet of some schools in India by latitude-longitude. Then she added the published content from Google to her map.
Let's explore a bit deeper. Let's say that I wanted to visualize the most commonly visited countries among my students. I can certainly examine the statistics from my Google form, as seen below:
However, my goal is really to see this data on a map. With the analysis tools in ArcGIS Online, this too is quickly done. The Aggregate Points tool will summarize points in polygons. For my polygons, I added a generalized world countries map layer, and then used Aggregate Points to summarize my point data within those countries. The result is shown below and is visible as a layer in the map I referenced above.
Another point worth noting is that you can adjust the settings of how your map interacts with your Google Sheet. Go to the layer's metadata page, and under “Published content & settings”, select "Automatically republish when changes are made." You can set the refresh interval to, for example, 1 minute, but the actual refresh on your map may take somewhat longer because Google’s “Auto re-publish” isn’t quite "real-time". Then do the following for the layer:
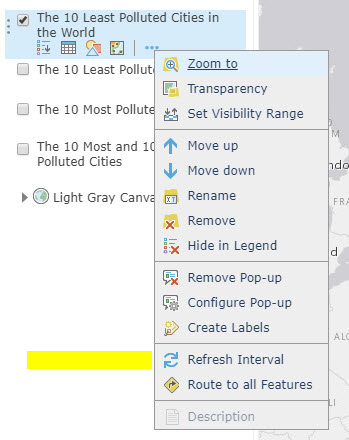
Note that if you are geocoding by address (such as city/country, as I did above, or street address), the automatic refresh option is not available:
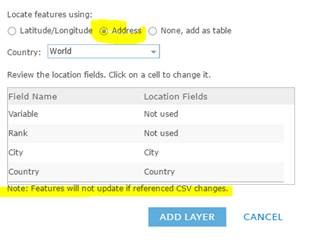
To get around this challenge, I manually added the latitude-longitude values to my cities spreadsheet. Thanks to the Measure tool in ArcGIS Online, this took less than 1 minute per city. I simply typed in the city name in ArcGIS Online, and used the Location button under the Measure tools, clicked on the map where the city was located, and entered the resulting coordinates into my spreadsheet.
For more information, see this blog essay.
You must be a registered user to add a comment. If you've already registered, sign in. Otherwise, register and sign in.
-
Administration
77 -
Announcements
80 -
Career & Tech Ed
1 -
Curriculum-Learning Resources
257 -
Education Facilities
24 -
Events
72 -
GeoInquiries
1 -
Higher Education
594 -
Informal Education
281 -
Licensing Best Practices
90 -
National Geographic MapMaker
33 -
Pedagogy and Education Theory
224 -
Schools (K - 12)
282 -
Schools (K-12)
272 -
Spatial data
35 -
STEM
3 -
Students - Higher Education
245 -
Students - K-12 Schools
128 -
Success Stories
36 -
TeacherDesk
1 -
Tech Tips
117
- « Previous
- Next »