Turn on suggestions
Auto-suggest helps you quickly narrow down your search results by suggesting possible matches as you type.
Cancel
- Home
- :
- All Communities
- :
- Products
- :
- Data Management
- :
- Data Management Questions
- :
- Re: �??Backward�?� type has no effect on the compo...
Options
- Subscribe to RSS Feed
- Mark Topic as New
- Mark Topic as Read
- Float this Topic for Current User
- Bookmark
- Subscribe
- Mute
- Printer Friendly Page
???Backward??? type has no effect on the composite relationship,
Subscribe
4080
9
04-05-2014 11:37 AM
by
Anonymous User
Not applicable
04-05-2014
11:37 AM
- Mark as New
- Bookmark
- Subscribe
- Mute
- Subscribe to RSS Feed
- Permalink
- Report Inappropriate Content
Original User: Jamal432@gmail.com
�??Backward�?� type has no effect on the composite relationship,
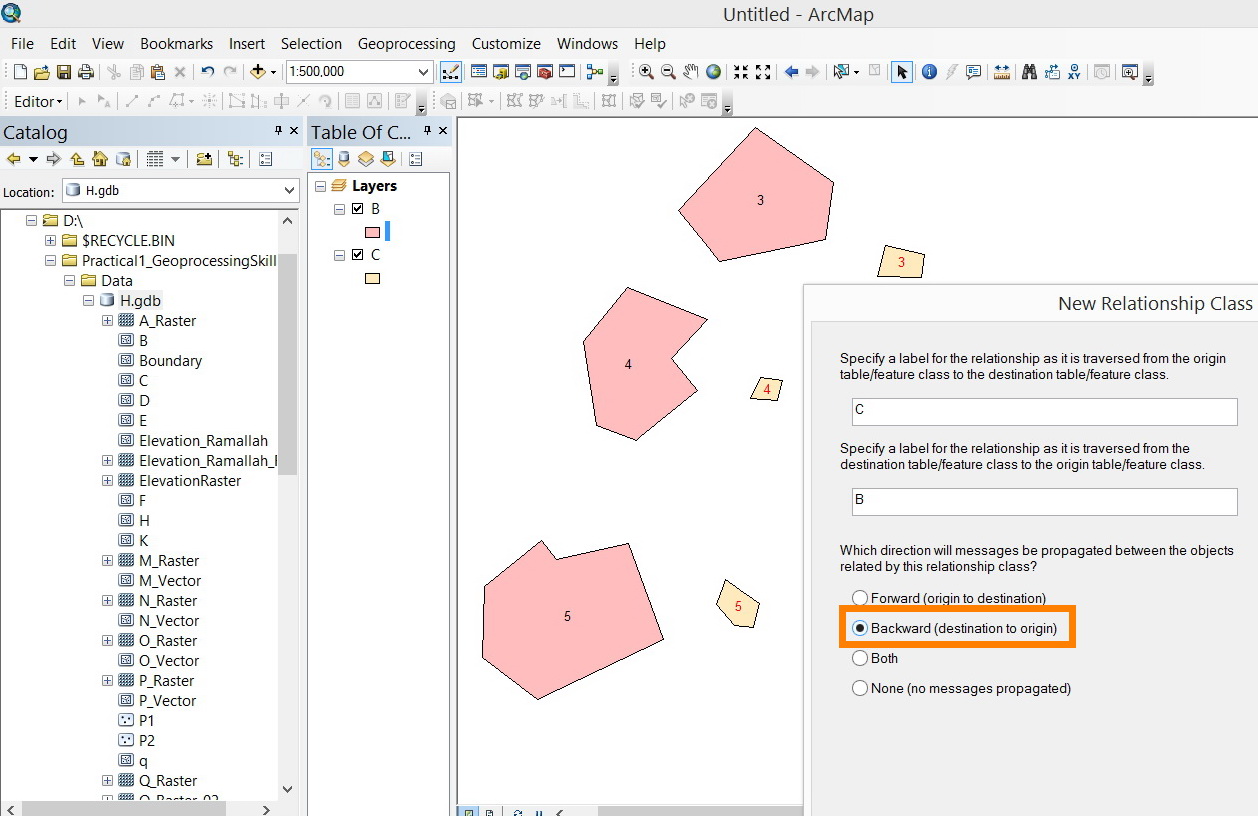
I have two layers B and C. I wanted to create a composite relationship between these two layers:
�?� Layer B is set as origin and layer C is set as destination
[ATTACH=CONFIG]32835[/ATTACH]
�?� The relationship is set to be composite
�?� The relationship is set to be �??Backward�?�
[ATTACH=CONFIG]32836[/ATTACH]
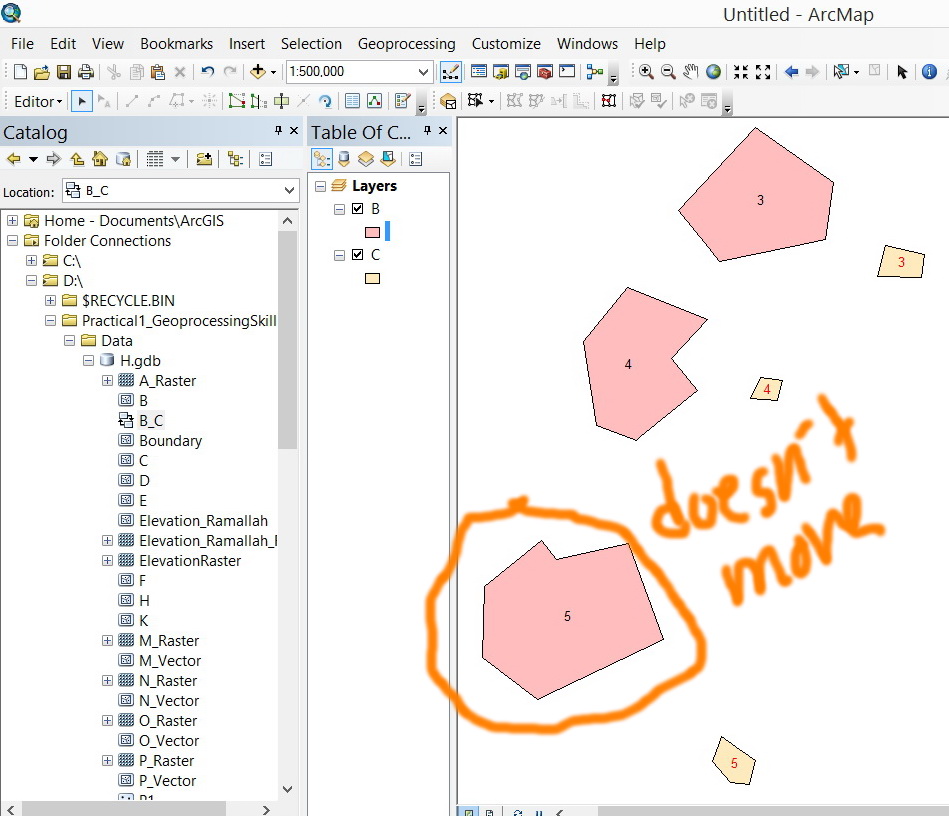
Now, as a feature of the C layer (destination) is moved, the related feature in the B layer (origin) doesn�??t move.
[ATTACH=CONFIG]32837[/ATTACH], [ATTACH=CONFIG]32838[/ATTACH]
What might be the issue here?
Thank you
Best
Jamal
�??Backward�?� type has no effect on the composite relationship,
I have two layers B and C. I wanted to create a composite relationship between these two layers:
�?� Layer B is set as origin and layer C is set as destination
[ATTACH=CONFIG]32835[/ATTACH]
�?� The relationship is set to be composite
�?� The relationship is set to be �??Backward�?�
[ATTACH=CONFIG]32836[/ATTACH]
Now, as a feature of the C layer (destination) is moved, the related feature in the B layer (origin) doesn�??t move.
[ATTACH=CONFIG]32837[/ATTACH], [ATTACH=CONFIG]32838[/ATTACH]
What might be the issue here?
Thank you
Best
Jamal
9 Replies
by
Anonymous User
Not applicable
04-05-2014
11:55 AM
- Mark as New
- Bookmark
- Subscribe
- Mute
- Subscribe to RSS Feed
- Permalink
- Report Inappropriate Content
Original User: crafty762
Hi Jamal,
Other than deleting features, a configuration involving composite relationship class with backward direction will require require custom programming. Please see the note "No other effect unless custom behavior is programmed" listed in the chart about two-thirds of the way down in the Relationship Class Properties help section. You can swap your destination and origin and then change the relationship class properties to use composite with forward direction, OR you can simply modify you current configuration and change the direction flow to Both rather than Backward.
04-06-2014
10:58 AM
- Mark as New
- Bookmark
- Subscribe
- Mute
- Subscribe to RSS Feed
- Permalink
- Report Inappropriate Content
Hi Jamal,
Other than deleting features, a configuration involving composite relationship class with backward direction will require require custom programming. Please see the note "No other effect unless custom behavior is programmed" listed in the chart about two-thirds of the way down in the Relationship Class Properties help section. You can swap your destination and origin and then change the relationship class properties to use composite with forward direction, OR you can simply modify you current configuration and change the direction flow to Both rather than Backward.
Many thanks William for the input.
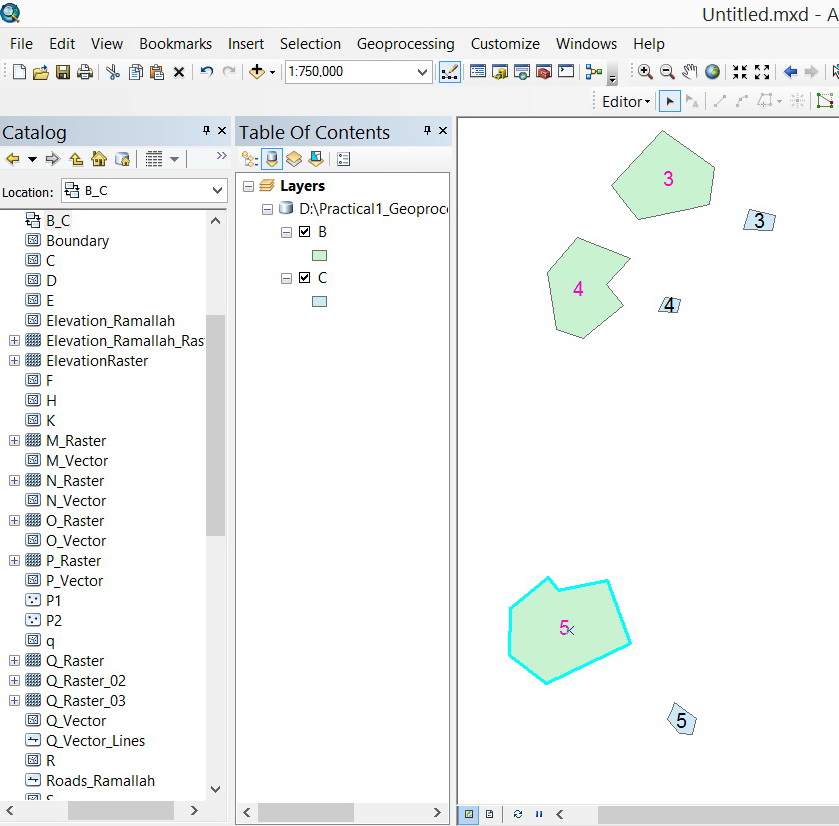
I selected the type to be �??Both�?� nevertheless, as the destination features layer are moved, their related features in the origin layer are not.
[ATTACH=CONFIG]32849[/ATTACH], [ATTACH=CONFIG]32850[/ATTACH], [ATTACH=CONFIG]32851[/ATTACH], [ATTACH=CONFIG]32852[/ATTACH]
In the screenshot below, the feature number 5 (of the destination layer) is moved with its related feature in the origin layer is not
[ATTACH=CONFIG]32853[/ATTACH]
What might be the issue here? What is the advantage of having Backward, Both and none options?
----------------------------------------
Jamal Numan
Geomolg Geoportal for Spatial Information
Ramallah, West Bank, Palestine
Jamal Numan
Geomolg Geoportal for Spatial Information
Ramallah, West Bank, Palestine
by
Anonymous User
Not applicable
04-06-2014
11:12 AM
- Mark as New
- Bookmark
- Subscribe
- Mute
- Subscribe to RSS Feed
- Permalink
- Report Inappropriate Content
Original User: crafty762
Interesting. What happens if you move/rotate a feature in the origin? Does the related feature in the destination move as a result? Also, are you using an ArcView, ArcEditor, or ArcInfo license?
Interesting. What happens if you move/rotate a feature in the origin? Does the related feature in the destination move as a result? Also, are you using an ArcView, ArcEditor, or ArcInfo license?
04-06-2014
11:49 AM
- Mark as New
- Bookmark
- Subscribe
- Mute
- Subscribe to RSS Feed
- Permalink
- Report Inappropriate Content
Interesting. What happens if you move/rotate a feature in the origin? Does the related feature in the destination move as a result? Also, are you using an ArcView, ArcEditor, or ArcInfo license?
Thanks William.
My license is advanced (ArcInfo)
With the �??Both�?� option: Yes. If the origin is moved then the destination is moved
[ATTACH=CONFIG]32854[/ATTACH], [ATTACH=CONFIG]32855[/ATTACH]
----------------------------------------
Jamal Numan
Geomolg Geoportal for Spatial Information
Ramallah, West Bank, Palestine
Jamal Numan
Geomolg Geoportal for Spatial Information
Ramallah, West Bank, Palestine
by
Anonymous User
Not applicable
04-06-2014
11:55 AM
- Mark as New
- Bookmark
- Subscribe
- Mute
- Subscribe to RSS Feed
- Permalink
- Report Inappropriate Content
Original User: crafty762
That's great! So yes, depending on which feature class should be moved and which should move as a result (related) you would set up your relationship class accordingly using composite and "Both". Does this answer your question?
That's great! So yes, depending on which feature class should be moved and which should move as a result (related) you would set up your relationship class accordingly using composite and "Both". Does this answer your question?
04-06-2014
12:51 PM
- Mark as New
- Bookmark
- Subscribe
- Mute
- Subscribe to RSS Feed
- Permalink
- Report Inappropriate Content
That's great! So yes, depending on which feature class should be moved and which should move as a result (related) you would set up your relationship class accordingly using composite and "Both". Does this answer your question?
Thanks William.
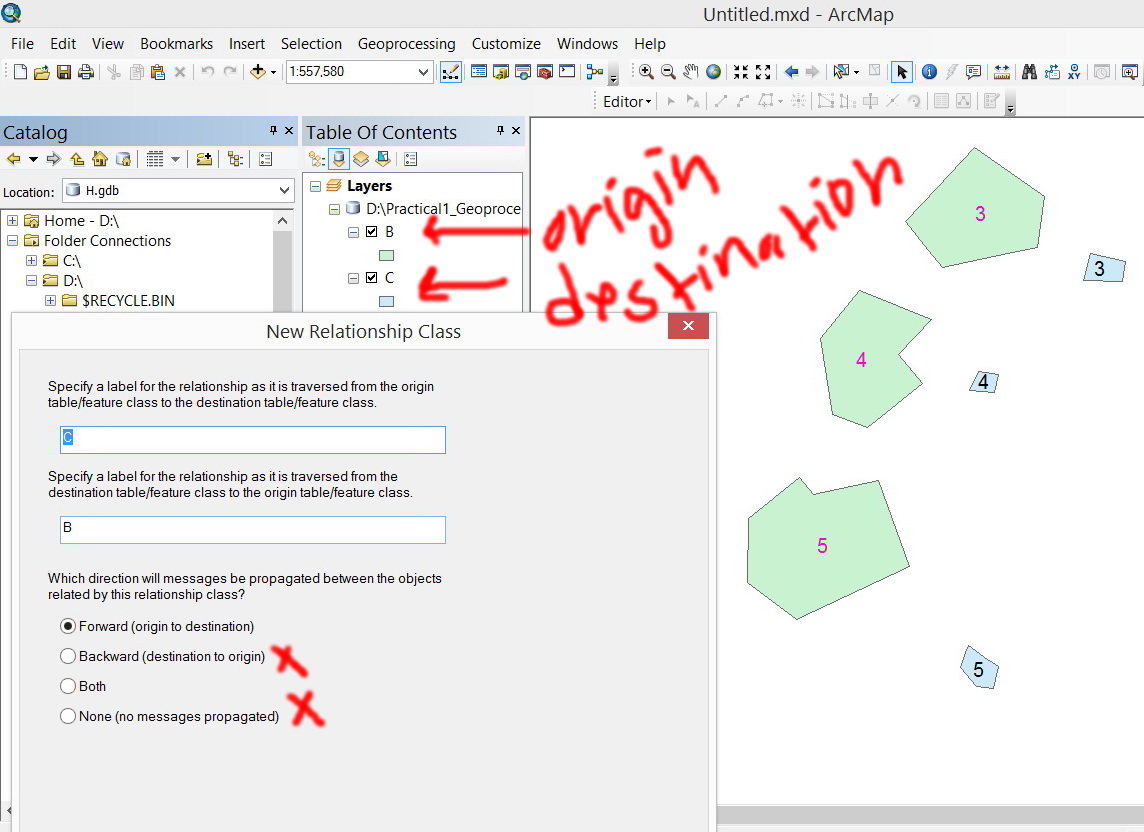
My issue here is that I couldn�??t understand the effect of selecting Backward\Both\None options
[ATTACH=CONFIG]32858[/ATTACH]
�?� If the type is set to be FORWARD, then if a feature of the origin layer is edited then its related feature in the destination layer is edited similarly as well. In return, editing the features of destination layer has no effect on the origin layer
�?� If the type is set to be BACKWARD, then if a feature of the origin layer is edited then its related feature in the destination layer is NOT edited. Likely, editing a feature of destination layer has no effect on the origin layer
�?� If the type is set to be BOTH: the behavior is the same as in FORWARD.
�?� If the type is set to be NONE: the behavior is the same as in BACKWARD.
Why the behavior is repeated in "BOTH" and "NONE" types?
----------------------------------------
Jamal Numan
Geomolg Geoportal for Spatial Information
Ramallah, West Bank, Palestine
Jamal Numan
Geomolg Geoportal for Spatial Information
Ramallah, West Bank, Palestine
by
Anonymous User
Not applicable
04-06-2014
02:46 PM
- Mark as New
- Bookmark
- Subscribe
- Mute
- Subscribe to RSS Feed
- Permalink
- Report Inappropriate Content
Original User: crafty762
Based on my understanding of the chart from the link I posted earlier in this thread, and based on the results of your testing, I am just as curious as you are about these settings. For both simple and composite relationships, the chart seems clear in describing the intended behavior but for whatever reason the observed behavior is different. Perhaps other members of the forum, and/or someone from Esri, will comment on their experiences with relationship classes.
Based on my understanding of the chart from the link I posted earlier in this thread, and based on the results of your testing, I am just as curious as you are about these settings. For both simple and composite relationships, the chart seems clear in describing the intended behavior but for whatever reason the observed behavior is different. Perhaps other members of the forum, and/or someone from Esri, will comment on their experiences with relationship classes.
04-08-2014
11:20 AM
- Mark as New
- Bookmark
- Subscribe
- Mute
- Subscribe to RSS Feed
- Permalink
- Report Inappropriate Content
Based on my understanding of the chart from the link I posted earlier in this thread, and based on the results of your testing, I am just as curious as you are about these settings. For both simple and composite relationships, the chart seems clear in describing the intended behavior but for whatever reason the observed behavior is different. Perhaps other members of the forum, and/or someone from Esri, will comment on their experiences with relationship classes.
Thanks William.
No other option. I wait the input of ESRI experts.
Best
Jamal
----------------------------------------
Jamal Numan
Geomolg Geoportal for Spatial Information
Ramallah, West Bank, Palestine
Jamal Numan
Geomolg Geoportal for Spatial Information
Ramallah, West Bank, Palestine
01-08-2021
10:05 PM
- Mark as New
- Bookmark
- Subscribe
- Mute
- Subscribe to RSS Feed
- Permalink
- Report Inappropriate Content
