- Home
- :
- All Communities
- :
- Products
- :
- Data Management
- :
- Data Management Questions
- :
- Re: Automatic X and Y in Attribute Table
- Subscribe to RSS Feed
- Mark Topic as New
- Mark Topic as Read
- Float this Topic for Current User
- Bookmark
- Subscribe
- Mute
- Printer Friendly Page
- Mark as New
- Bookmark
- Subscribe
- Mute
- Subscribe to RSS Feed
- Permalink
I work for a water/ww utility, and we are trying to map our system. I mostly have the map together to start collecting points. We are using Mobile GIS on a handheld device.
I can't figure out how to automatically add X and Y coordinates to the attribute table. I created domains for most of the fields, but I'm not so sure about this. When I collect a point, it collects the X,Y... but doesn't show it in the Attribute Table. I have found ways to manually add the columns, but don't want to have to do that every time. Is there a way I can create a domain, or whatever else, to make that happen?
Solved! Go to Solution.
Accepted Solutions
- Mark as New
- Bookmark
- Subscribe
- Mute
- Subscribe to RSS Feed
- Permalink
If you want to update all feature classes in a workspace, you could use some Python code to do so:
import arcpy
import os
ws = r"C:\Forum\DistLinePol\test.gdb"
fld_x = "POINT_X"
fld_y = "POINT_Y"
arcpy.env.workspace = ws
fds = arcpy.ListDatasets()
fds.append("")
for fd in fds:
fcs = arcpy.ListFeatureClasses(feature_dataset=fd)
for fc in fcs:
fcl = os.path.join(ws, fd, fc)
shape_type = arcpy.Describe(fcl).shapeType
if len(arcpy.ListFields(fcl, fld_x)) == 0:
arcpy.AddField_management(fcl, fld_x, "DOUBLE")
if len(arcpy.ListFields(fcl, fld_y)) == 0:
arcpy.AddField_management(fcl, fld_y, "DOUBLE")
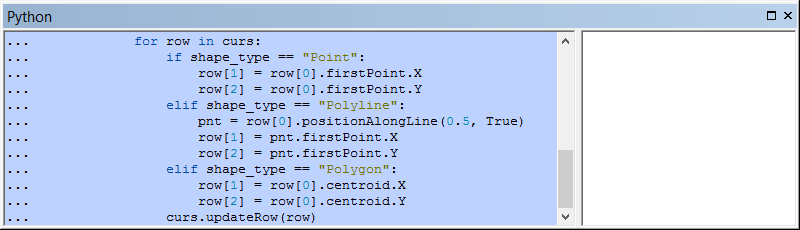
with arcpy.da.UpdateCursor(fcl, ("SHAPE@", fld_x, fld_y)) as curs:
for row in curs:
if shape_type == "Point":
row[1] = row[0].firstPoint.X
row[2] = row[0].firstPoint.Y
elif shape_type == "Polyline":
pnt = row[0].positionAlongLine(0.5, True)
row[1] = pnt.firstPoint.X
row[2] = pnt.firstPoint.Y
elif shape_type == "Polygon":
row[1] = row[0].centroid.X
row[2] = row[0].centroid.Y
curs.updateRow(row)Change the values on line 4 to 6 to set the path to the workspace and the fields to update. If the fields don't exist they are added in the process.
- Mark as New
- Bookmark
- Subscribe
- Mute
- Subscribe to RSS Feed
- Permalink
If you want to update all feature classes in a workspace, you could use some Python code to do so:
import arcpy
import os

ws = r"C:\Forum\DistLinePol\test.gdb"
fld_x = "POINT_X"
fld_y = "POINT_Y"

arcpy.env.workspace = ws
fds = arcpy.ListDatasets()
fds.append("")
for fd in fds:
    fcs = arcpy.ListFeatureClasses(feature_dataset=fd)
    for fc in fcs:
        fcl = os.path.join(ws, fd, fc)
        shape_type = arcpy.Describe(fcl).shapeType
        if len(arcpy.ListFields(fcl, fld_x)) == 0:
            arcpy.AddField_management(fcl, fld_x, "DOUBLE")
        if len(arcpy.ListFields(fcl, fld_y)) == 0:
            arcpy.AddField_management(fcl, fld_y, "DOUBLE")
        with arcpy.da.UpdateCursor(fcl, ("SHAPE@", fld_x, fld_y)) as curs:
            for row in curs:
                if shape_type == "Point":
                    row[1] = row[0].firstPoint.X
                    row[2] = row[0].firstPoint.Y
                elif shape_type == "Polyline":
                    pnt = row[0].positionAlongLine(0.5, True)
                    row[1] = pnt.firstPoint.X
                    row[2] = pnt.firstPoint.Y
                elif shape_type == "Polygon":
                    row[1] = row[0].centroid.X
                    row[2] = row[0].centroid.Y
                curs.updateRow(row)
Change the values on line 4 to 6 to set the path to the workspace and the fields to update. If the fields don't exist they are added in the process.
- Mark as New
- Bookmark
- Subscribe
- Mute
- Subscribe to RSS Feed
- Permalink
Where would I put this code?
- Mark as New
- Bookmark
- Subscribe
- Mute
- Subscribe to RSS Feed
- Permalink
Hi Alex,
The steps are as follows (using the python window and not the standalone method in a python IDE):
- copy the code to a text editor like notepad or notepad++ (don't use IE, since it will probably copy the line numbers as well)
- In the text editor change the values in line 4 to 6 to match your data
- Copy the text (code) to the clipboard
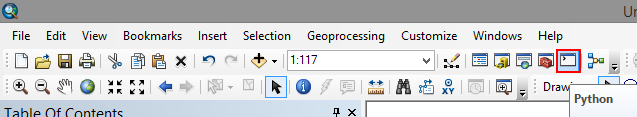
- In ArcMap, show the python window: click on the Python Window button to the right of the standard toolbar:
- This will open the python window (probably floating)
- Right click in the Python window as select Paste:
- Press the Enter key until the code executes (probably twice)
- After execution you will see the prompt: ">>> "
- Check your data to see if it worked
In case of any error message post it here and we'll see what is going wrong.
- Mark as New
- Bookmark
- Subscribe
- Mute
- Subscribe to RSS Feed
- Permalink
The code can be easily expanded to loop through multiple locations of data. If that is what suits your specific case.
- Mark as New
- Bookmark
- Subscribe
- Mute
- Subscribe to RSS Feed
- Permalink
I ran your code with lines 4-6 as:
ws = r"Y:\GIS\MU Geodatabase.gdb\Sanitary_Sewer"
fld_x = "Point_X"
fld_y = "Point_Y"
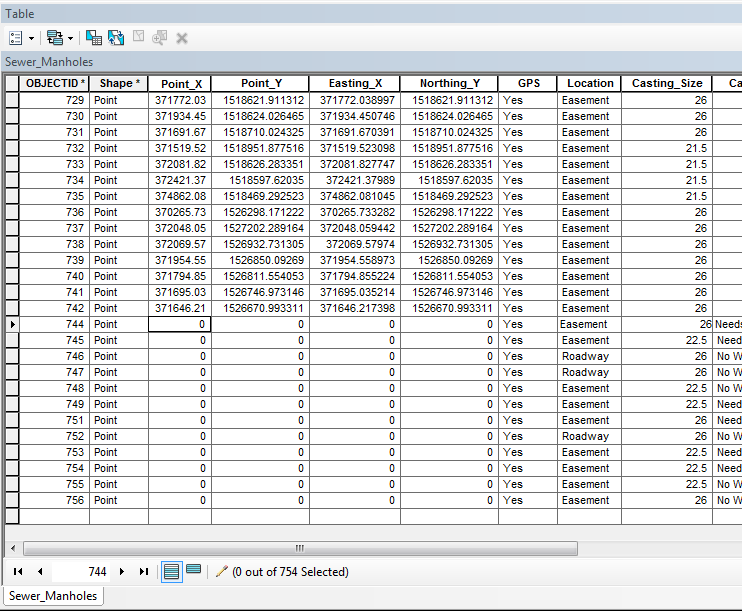
I created a mobile cache, put it on the handheld, collected points, and updated my map with the new points.
Data didn't show up in the new fields (Point_X and Point Y). The just filled in with 0's. I left my original fields that I had added manually (Easting_X and Northing_Y) just to compare.
- Mark as New
- Bookmark
- Subscribe
- Mute
- Subscribe to RSS Feed
- Permalink
What if you run it with:
ws = r"Y:\GIS\MU Geodatabase.gdb"... without specifying "Sanitary_Sewer" what I assume is a feature dataset. If that does not work, please attach a sample of you data to debug the code.
- Mark as New
- Bookmark
- Subscribe
- Mute
- Subscribe to RSS Feed
- Permalink
Another way is to add the XY data in Desktop after you are done collecting the data points.
Open the point feature class in Desktop.
Check your projection under Dataframe Properties to be sure you are using your projection of choice.
Open the Attribute table.
If you have not already, add 2 new fields called "X" and "Y" (or whatever you like).
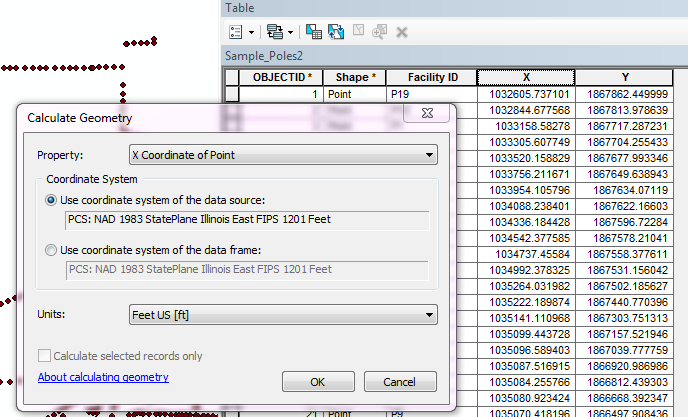
Right click on the new "X" field header and choose "Calculate Geometry".
Chose Yes to continue at the warning pop-up.
You will see it has a Property drop down to select the X or Y coordinate (choose X for the X column and Y for the Y column !) .
You can pick the data source projection or your dataframe's projection (if different).
Repeat for the "Y" field in the table.
Good luck!
- Mark as New
- Bookmark
- Subscribe
- Mute
- Subscribe to RSS Feed
- Permalink
I thought the idea was to do this automatically as the post title states. This sounds pretty manual to me.
- Mark as New
- Bookmark
- Subscribe
- Mute
- Subscribe to RSS Feed
- Permalink
Alex,
the add X Y Coordinates Tool may be of use:
If you are only updating a single file it should be pretty simple to create a stand alone Python file (.py) that you can call from a windows scheduled task at what ever time interval you like (could be at the end of each day).
if you want to update multiple files then you would need to combine the code with Xanders to loop through all of your feature classes in a folder.
Regards
Anthony