Conservation GIS - Page 2

cancel
Showing results for 
Show  only  | Search instead for 
Did you mean: 

Latest Activity

(26 Posts)
by Anonymous User
Not applicable

Return to SCGISReturn to 2018 ScholarsGo to scgis.orgGo to Conservation GIS 

Dr. Jackson “Zozo” Katampi, Senior Wildlife Veterinary Officer, Zambia Dept of National Parks and Wildlife

Private Bag 1, Kafue Road, Chilanga, Zambia
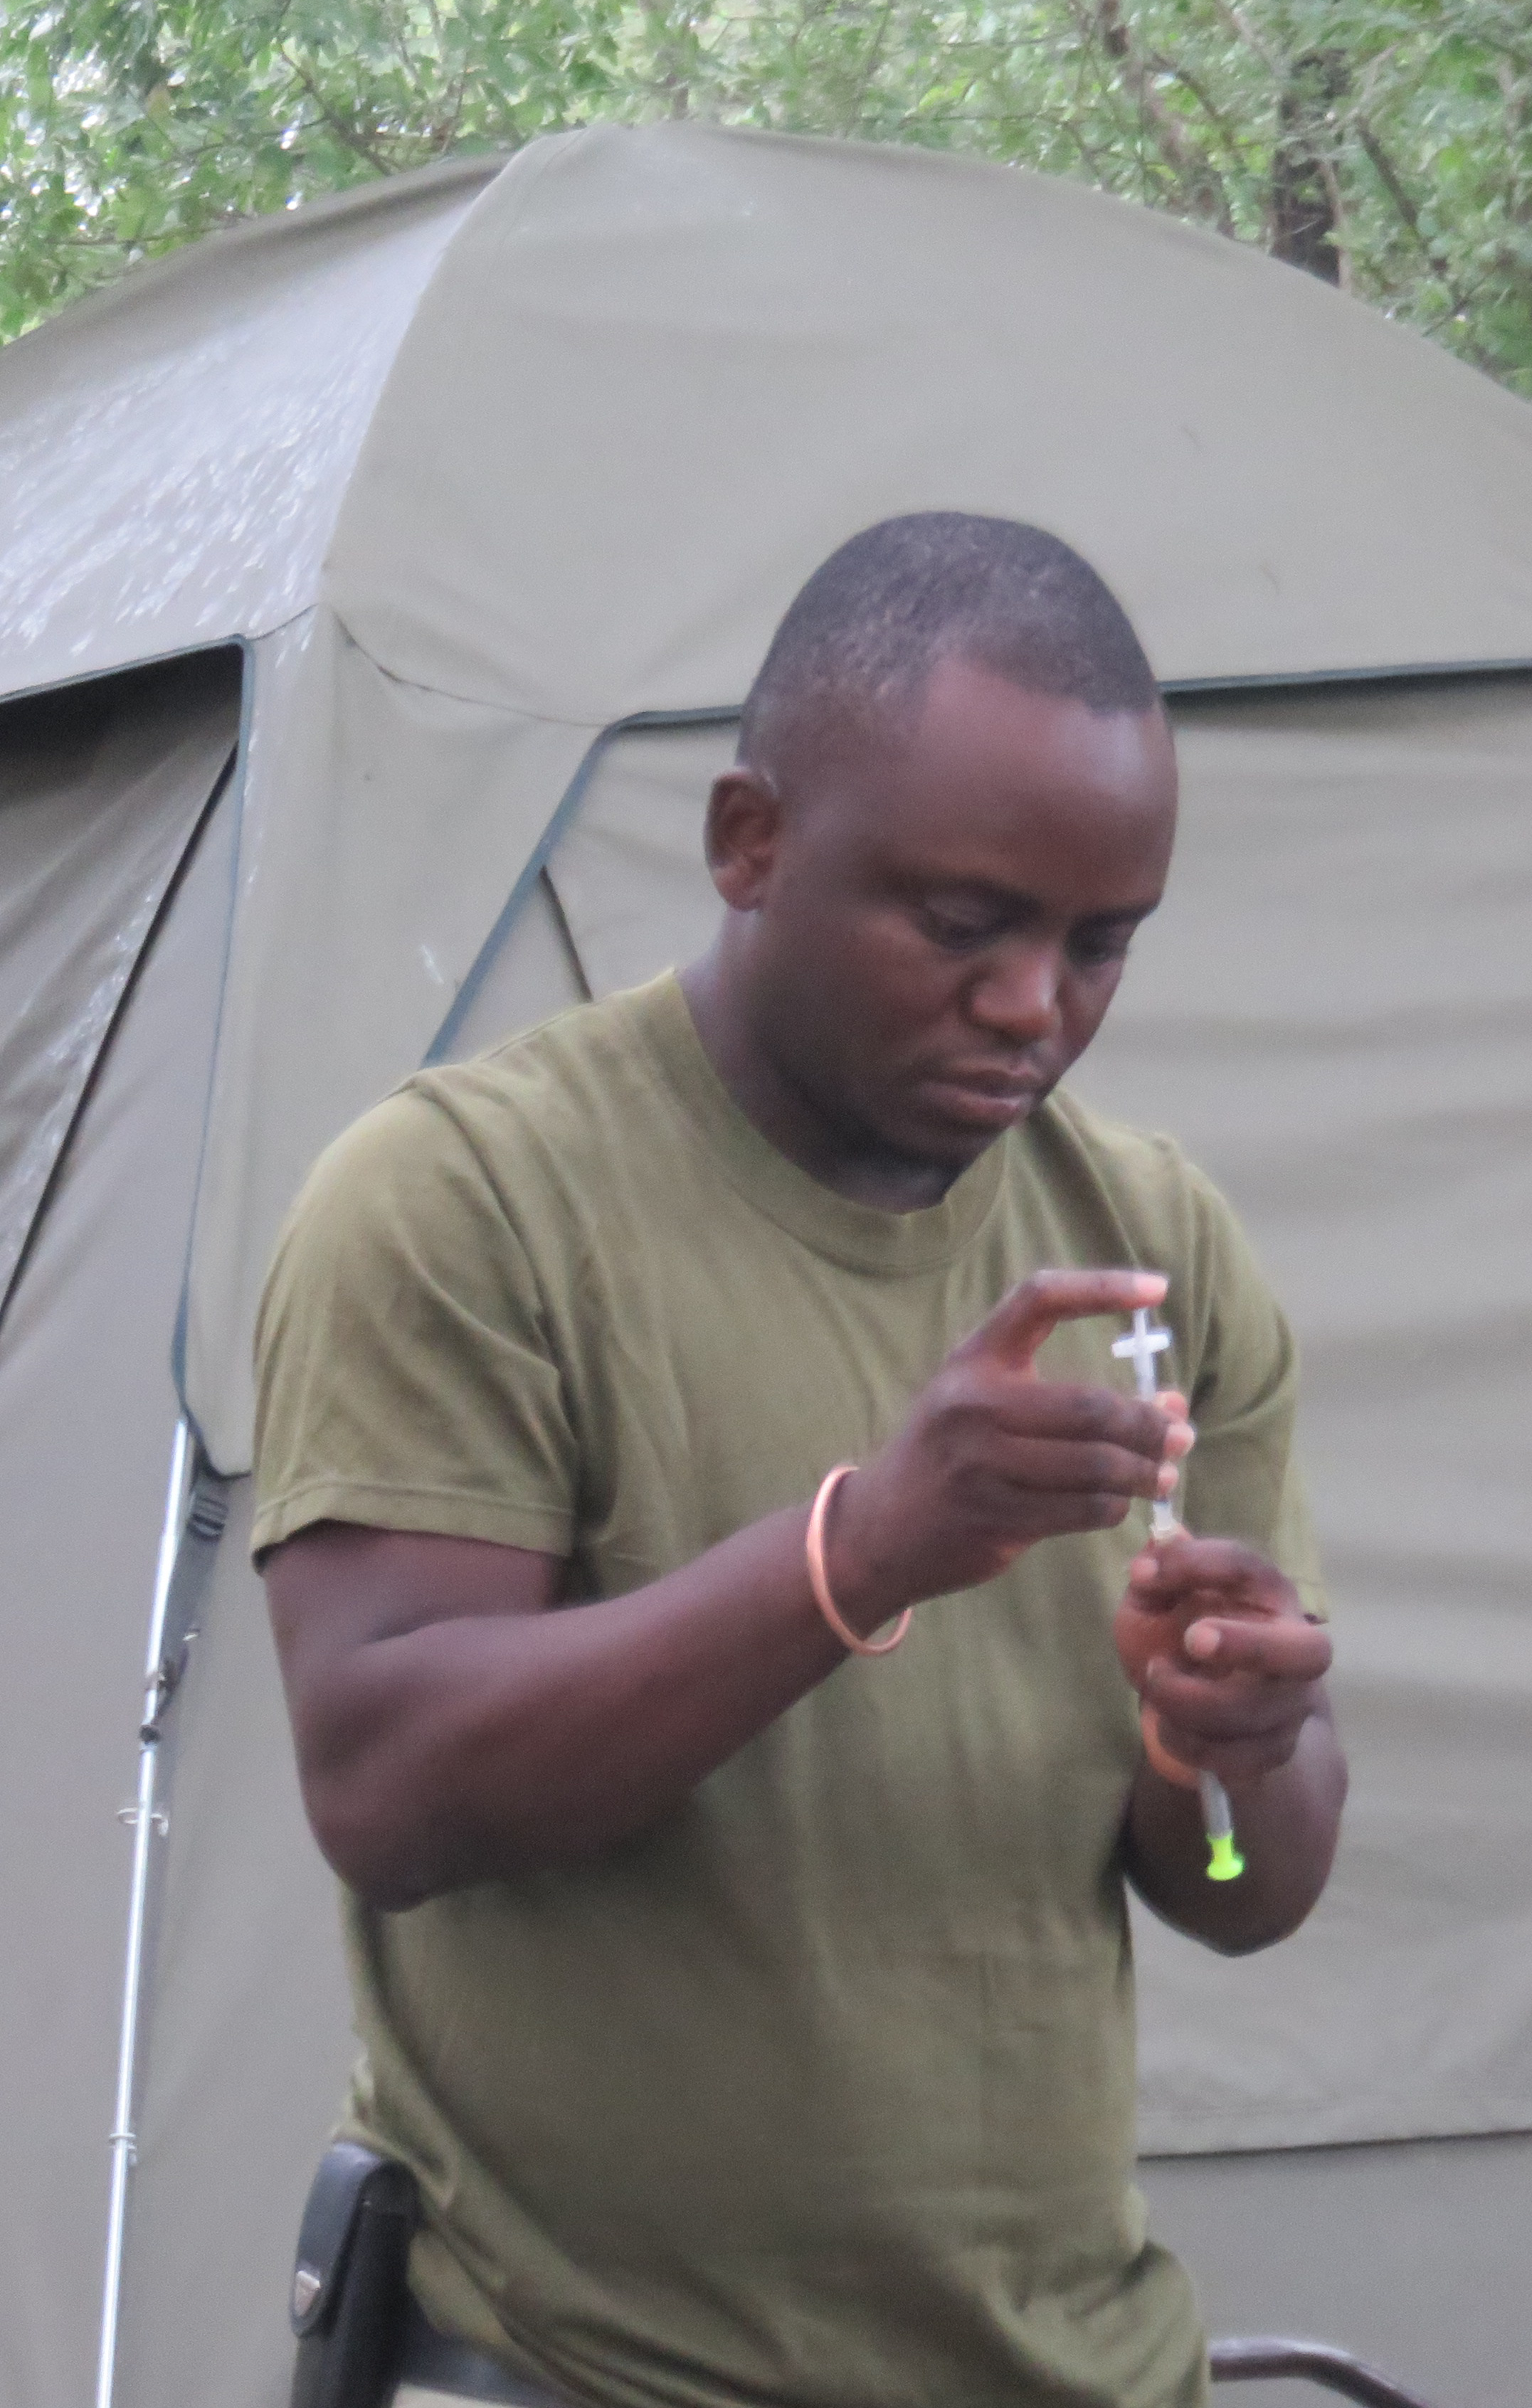
*-Main email:   infor@zawa.org.zm     Website: www.zawa.org.zm               (Scgis Years: yr18 ) 

your email: jacksonzozo10@gmail.com  and jacksonmcnight@yahoo.comjacksonmcnight@yahoo.com

It is without mention how important the use of GIS is in my line of work. I have realized with time that I need to have the knowledge of GIS, this made me to join the local SCGIS chapter which has helped me to learn the basics. However, this has made me to realize just how much I need to learn more on GIS so that I can use it in my line of work to contribute effectively in conservation world locally, internationally as well as get to share knowledge with GIS practitioners and hence, make sound decisions and recommendation to my organization on the best way to manage our wildlife. I therefore, look forward to be a competent GIS user. This training will build capacity in individuals such as myself that are at the helm of conservation efforts in Zambia. Following the training, I wish to engage myself with more GIS in my work to foster conservation efforts in Zambia.  This training is not only important to me, but also to my country, as i will effectively contribute to management on the best way to conserve wildlife. It will help me analyze public health disease incidence, patterns and outbreaks, this will ensure that measures are taken to protect the surrounding communities from zoonotic disease especially those from wildlife. Either over 64% of the zoonotic diseases can be traced back to wildlife, which can act as a vector, or a host, understanding these diseases by analyzing their occurrence patterns will aid in prevention of spread into human populations. As a conservationist, my work involves interacting with several other disciplines, and therefore, this training would also provide an opportunity to learn and appreciate a varied capabilities and use of GIS in these other disciplines, as I will be able to share my knowledge. The training will also give an opportunity to meet other individuals from different parts of the world, share knowledge and foster a good global network in the fight for conservation of wildlife.


*-YOUR ORGANIZATION’S WORK: The Department of National Parks and Wildlife was established by an act of parliament (Zambia Wildlife Act 14 of 2015). The department is under the Ministry of Tourism and Arts, it is mandated to manage and regulate the wildlife estate for the purpose of conservation and enhancement of wildlife eco-systems, biodiversity, and of objects of aesthetic, pre-historic, historical, geological, archaeological and scientific interest. It manages 20 national parks and 36 Game Management Areas. These constitute close to 35% of the country's entire landmass. The department targets all wildlife species in National parks including, large mammals, birds, amphibians etc. and the ecosystems in which they depend on. Habitats covered by the organization Includes Wetlands, Woodlands, Forests and Grasslands. In addition to wildlife in protected areas, the department also manages wildlife in open areas and to some extent those on private estates.


I'm currently working as a senior wildlife veterinary officer, under 2015 SCGIS International Scholar Dr. David Squarre.  I have been working for the department of national parks and wildlife formerly Zambia Wildlife Authority for almost four years now. My role in the department is to provide scientific and veterinary support for the biological management of wild fauna. My duties include to supervise and undertake the capture and immobilization of wild animals for the purpose of;

  • translocation as a tool to manage wildlife populations in protected areas as well as private wildlife estates.
  • Clinical interventions for injured and wounded or snared animals as a result of direct anthropogenic activities.
  • implementing countrywide programs for the detection, control and management of diseases occurring in protected areas and in wildlife populations.
  • Establishing a programme for prevention, control, diagnosis and treatment of diseases affecting the health of wild animals and zoonosis.
  • Facilitating wildlife breeding programmes.
  • Establishing and maintaining a database on disease distribution and control, causes and origin.
  • Initiating and supporting research/projects that involve diseases and biological management of key wildlife species such as White and Black Rhino, Elephants, Lions etc

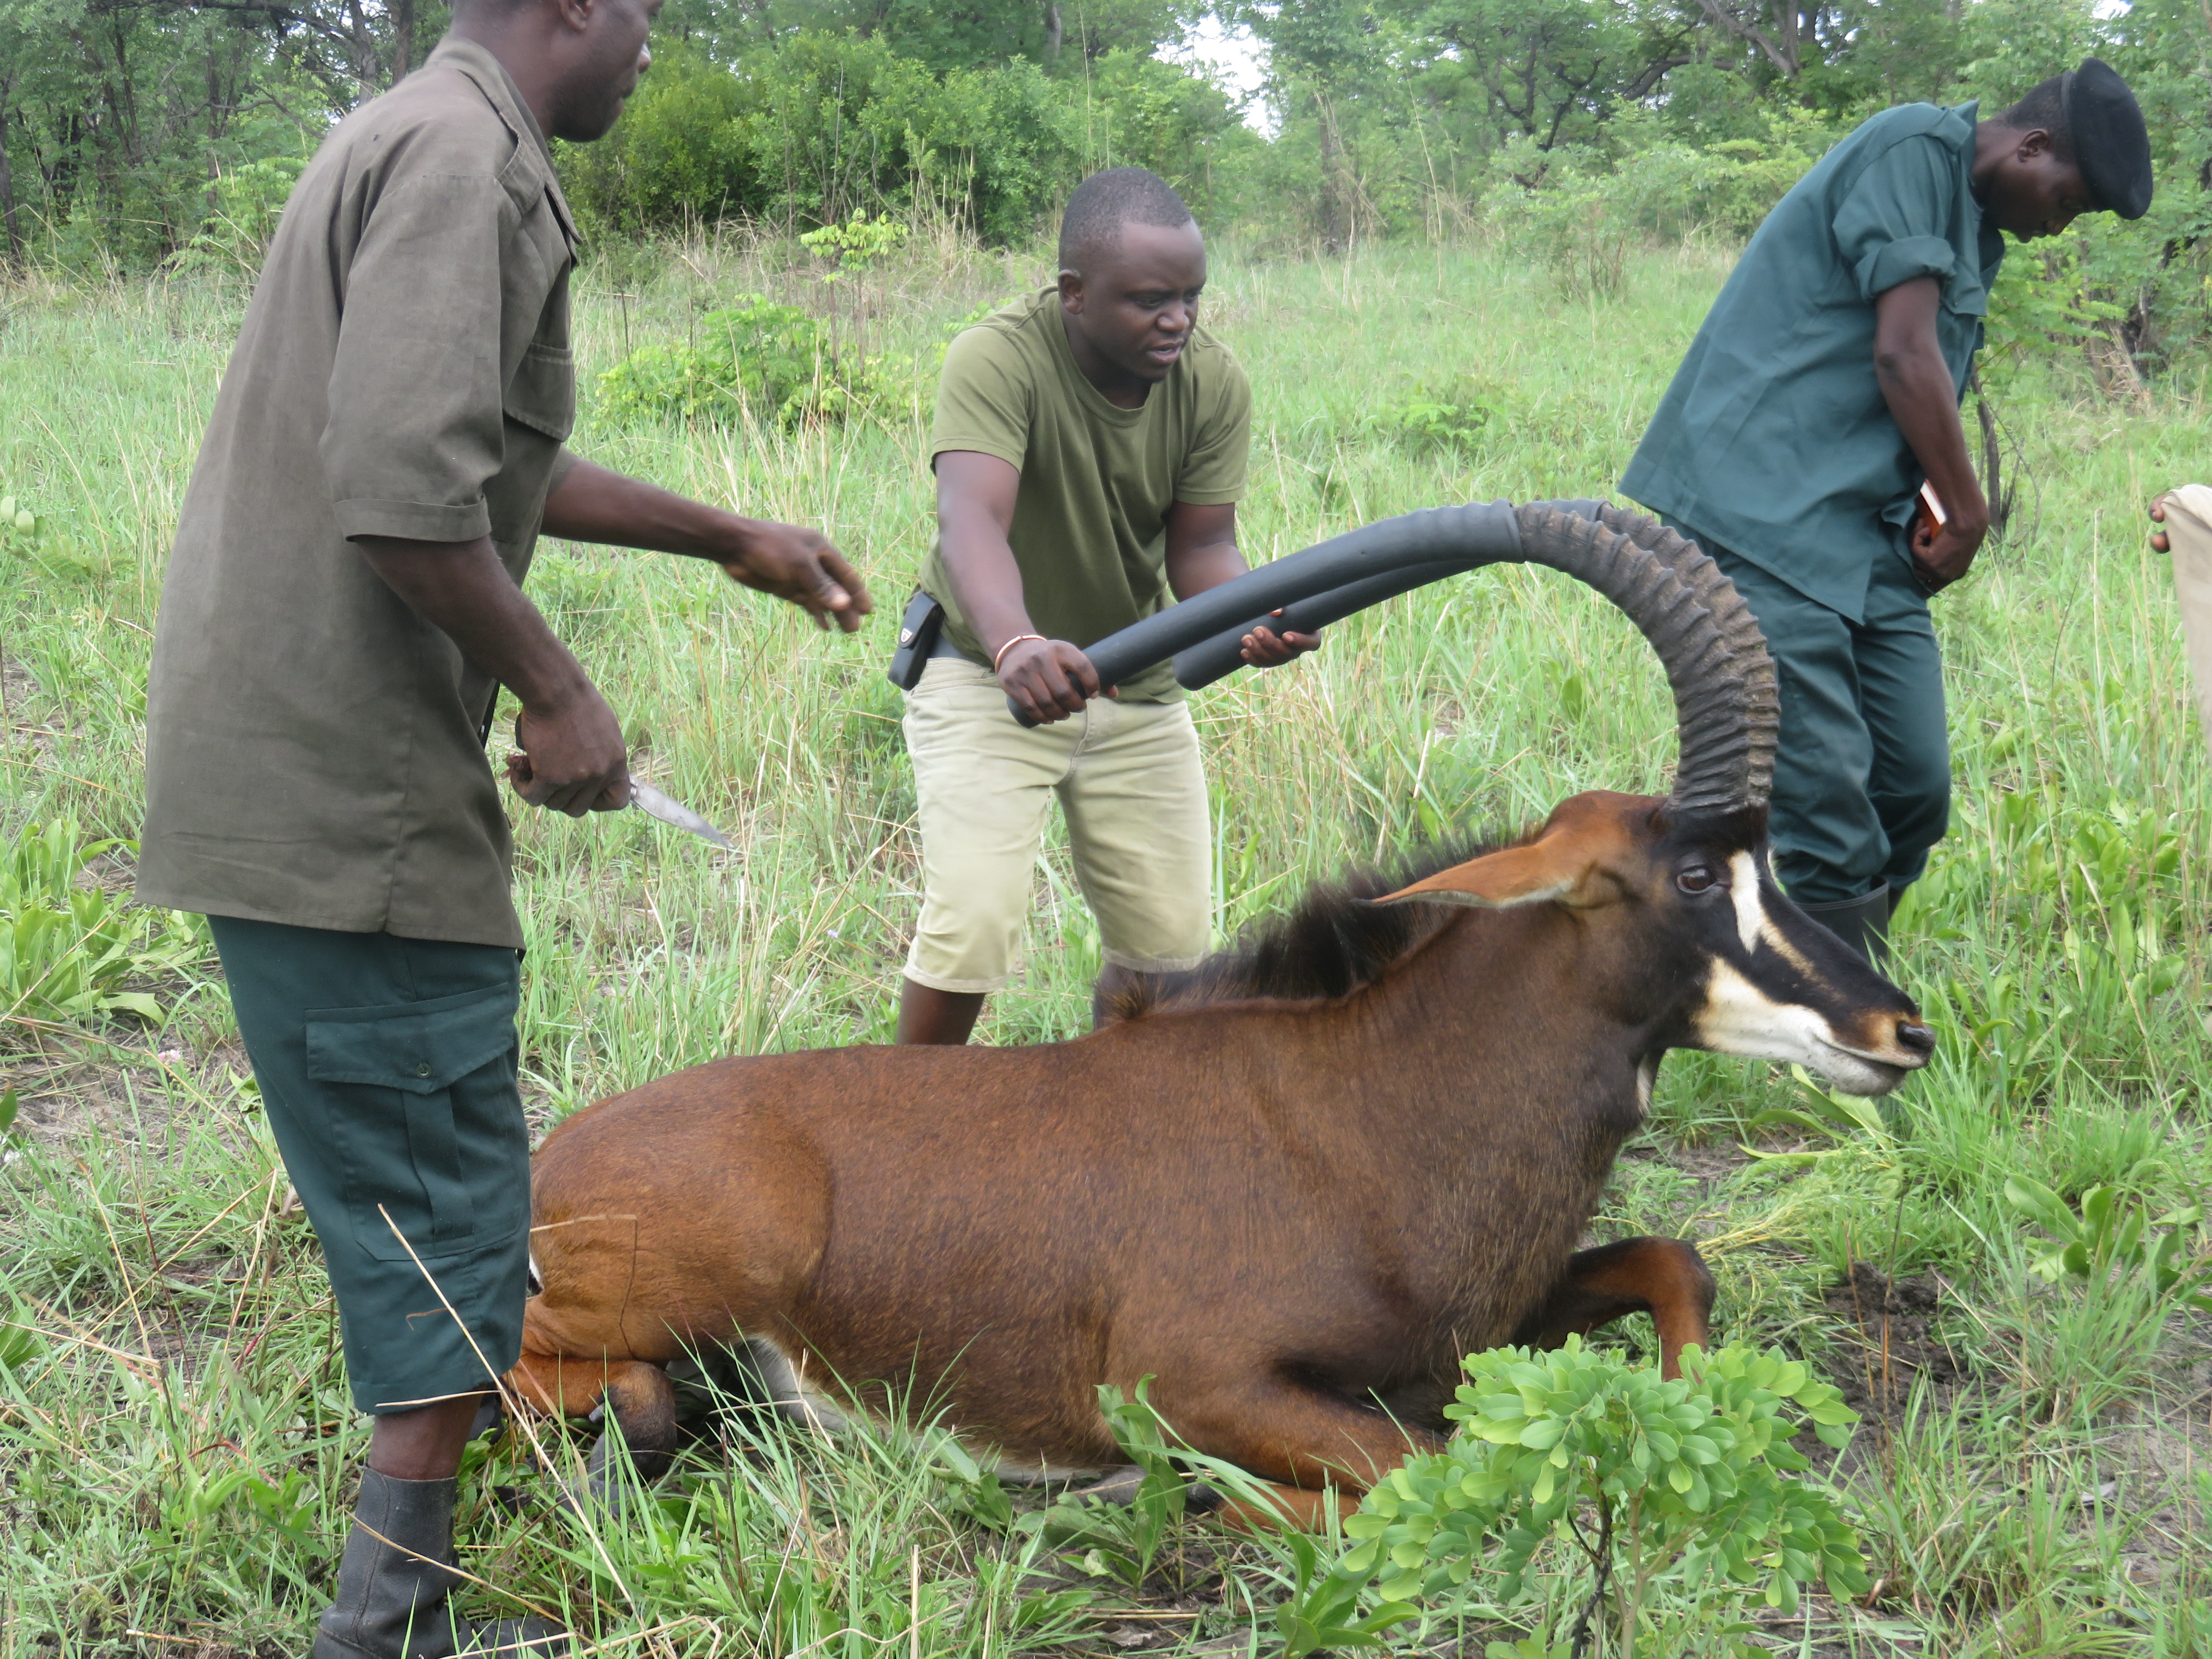
In addition to the above, I have been working with organization such as Wild Wide Fund for Nature (WWF) to restock the Sioma Ngwezi National Park, Peace Parks, KAZA and Panthera to come up with and restock community conservancies and community partnership parks. I also work with Frankfurt zoological society in the efforts to reintroduce Black rhinos in the North Luangwa national park. I am more recently involved with the Wildlife crime prevention program in which, the objective is to identify key spot areas for carnivore poaching. I collect samples and map areas in which these carnivore offtakes are found.

 *-HISTORY: My first experience with conservation GIS was when I was attached to the Zambia Wildlife Authority as a student, during my attachment I leant how to draft maps for the distribution of different habitats and hence, determine the extent environmental degradation in areas that have been depleted of wildlife such as Lukusuzi National Park, this was for so purpose of identifying areas that can still support wildlife. After University, I joined the SCGIS Zambia Chapter, to which I am a member of this chapter working mostly in protected areas. I use GIS now to monitor monthly white rhino movements in Mosi-oa-tunya National park. I have equally collared some Sables that we recently translocated to Sioma Ngwezi national park with the purpose of restocking the area; these are collared with GPS collars, which are giving data on the movement of the animals every two hours. This information is used to map and monitor their movement; as a result, we are to advise our operation and anti-poaching team to direct their efforts to areas where these animals are mostly found. In more recent times and in collaboration with the SCGIS Zambian chapter, I managed to use GIS to record and report disease information, GIS is usually used to produce maps of disease incidence, prevalence, mortality, morbidity in national parks, private wildlife estates, and wildlife sanctuaries. The information is more easily understood when visualised on a map which are important tools field analysis.


 Local SCGIS work: I am a bonafide paid up ordinary member of the local SCGIS Chapter (SCGIS–Zambia Chapter) and participate in various activities organized by the chapter in the provision of logistics while doubling as a resource person.


Local Community work: I have been a youth leader for a number of years advocating for youth participation in decision making. I’m currently the country representative for Wildlife Students Association. Being a senior veterinary officer, I have 4 veterinarians that I supervise and teach various field skills that I have learnt over the years as a conservationist. My leadership skill spring far back when I was in high school where I held different leadership positions such as University of Zambia Veterinary Students Association President, Zambia Young Christian Students National Secretary, Chairperson and Founder of a youth organization called Youth Turn-up etc. These leadership position have enhanced not only my ability to have strong team work skills but also improved my communication, teaching and public speaking skills.


What is the most challenging about the conservation/GIS work that you do?

The uniqueness of the work I do is based on the complex analysis which we do, when data is collected, for example species distribution in Mosi-oa-tunya National Park, ideally we are supposed to collect the data at once to save on cost, therefore, during analysis, apart from the actual animal distribution, one needs to analyze the disease incidence in a particular population distribution. One of the major challenge is the limitation of the GIS software availability and knowledge. As a result, this data is not fully analyzed. Another challenge is the use of GIS in outbreak investigations and disease spread patterns, which is critical but usually is limited.


Plan for the next year: Once I have been trained, I plan to use the skill and knowledge that I will acquire in the following way:

  1. Map the seasonal movement pattern of the white rhinos in Mosi-oa-tunya National Park. This is very important, as it will enhance adequate planning when it comes to their protection. I will produce detailed maps indicating risk areas in relation to their movement in dry season by November, 2018
  2. Map all the elephant corridors in prime human/wildlife conflict areas in southern and western provinces of Zambia. This activity will be completed by March 2019.
  3. Simulate and model disease/infection dynamics and spread in wildlife areas and the risk to public health in the surrounding communities. This data will help in the mitigation, prevention and control of such diseases and infection.
  4. Map the animal unknown mortalities that happen in protected areas, this will help us store data and make follow ups in case of disease occurrence. This continuous activity will start as soon as I gain the needed knowledge.
  5. Participate in training and help the chapter in dissemination of GIS to conservation communities and practitioners.
  6. Help in mapping all private wildlife estates in southern and western region of Zambia by April 2019.


GIS work: As earlier stated, I have basic knowledge of GIS, which I have learnt due to personal interest, as my work requires that I have knowledge of GIS, which is very instrumental in daily work as a wildlife veterinarian. The internet has been the core center of my learning, in addition, my knowledge of GIS has also been through mentors such as Mr. Chaka Kaumba, and Chabala Chiyaze, this has been made possible because of my affiliation to the SCGIS Zambia Chapter.   My GIS Expertise levels are intermediary. I use ARCVIEW 10.3 mostly to do basic mapping works. My work with GIS has mainly involved mapping seasonal distribution of mammal species, mainly working with the white rhinos in Mosi-oa-tunya National Park, Sable, Lions and Elephants in Kafue/Sioma Ngwezi National Park. This involves collecting GPS positions of the animals when sighted, collecting the environmental conditions at that particular position i.e. abundance data, vegetation type, soil type, water levels and creating a data base of these locations. I do this in regular intervals. Then map these so as to show seasonal distribution or local migrations of the rhino in particular and hence, relate their movements to water levels, food availability etc. This helps us to have a good monitoring system and enhances wildlife protection. In addition, I also collect GPS coordinates for all carcasses found in protected areas in order to relate particular disease incidences and this helps in wildlife disease surveillance.


*-Title / Abstract of the paper you will present:

Use of GIS to determine the distribution of Large Mammals in Mosi-oa-tunya National Park

Mosi-oa-Tunya National Park covers 66 km2 (25 sq mi) from the Songwe Gorge below the falls in a north-west arc along about 20 km of the Zambezi river bank. The National Park is home to the might Victoria Falls, which is one of the seven natural wonders of the world. The animals in the National Park are not evenly distributed. A ground count was therefore conducted to determine the populations and distribution of large mammals.


The park also houses the only prolific population of white rhinos. It has been over 10 years since the last count was done. The paper also focuses on the impact of the elephants on the park habitat and whether or not this has had any effect on the distribution of the animals in the last 10 years.


more
1 0 645
Ee_HungKhew
New Contributor

Navigation:  2017 Scholar Project  2017Conference   ReferenceProject   CommunitiesPage   ConservationGIS  Scgis.org

Khew Ee Hung, Rakuno Gakuen University, Japan/ Malaysia

*-Organization name: Rakuno Gakuen University (RGU)    xPark xRemote xEducation xPlan  xDisabilityJustice

X2017Scholar  x2017Talk  xTalk  xScholar xJapan xMalaysia xAsia

loading....
*-Organization street address 582, Bunkyodai-Midorimachi, Ebetsu, Hokkaido 069-8501, Japan
*-Country: Japan
*-Work phone +8111-3861111
*-Work fax +8111-3884129
*-Scholar Email: kheweehung@gmail.com
*-Organization Web site : http://en.rakuno.ac.jp/

*-ORGANIZATION’S WORK: RGU was established in 1960 with only one department known as Department of Dairy Science. With the concept of “tri-love” from Christianity which means “love God, love people and love soil” and “healthy soil, healthy people” as the pillar of education, the school has since strived to nurture more individuals not only academically excellent but also leaders who show the quality of humanity. RGU today is divided into College of Agriculture, Food and Environment Sciences which includes Department of Sustainable Agriculture, Department of Food Science and Human Wellness, Department of Environmental and Symbiotic Science, and School of Veterinary Medicine which includes Department of Veterinary Medicine and Department of Veterinary Science. RGU also works academically with more than 33 institutions around the globe academically. (Photo Right: Khew in 2014 at Penang National Park, study site for her masters degree)

As I am from Environmental GIS Laboratory under the Department of Environmental and Symbiotic Science, we uses advance technologies including GIS, drones and remote sensing in agricultural, environmental and environmental education field. For examples, we use drones to capture picturesloading.... of the agricultural field, study the changes using NDVI and other formulation; we use GPS collars to be attach to the Sika deer to identify their movements; we use satellite images to analyze the location affected by the overgrazing sika deer population; we compare the changes of the environment today with the old days; we carrying out the environmental education with huge size maps at local schools; we share our technologies with the developing countries through programs and cooperation and etc. *.

*-ROLE IN THE ORGANIZATION: I am currently an assistant GIS analyst and a part time lecturer after I completed my Master Degree in March 2017. When I was a Master Degree student, I did not only study and carrying out study for my Master Dissertation but I also acted as a Teaching Assistant in assisting the Undergraduate students on basic GIS and GIS application learning. Also, as a foreign student who can speak English in RGU, I assisted and are still assisting the foreigner participants who come here for "Remote Sensing of Forest Resources" and the foreign students from countries such as Malaysia and Thailand who come here under student exchange programs or internship especially during basic GIS lectures whenever possible. (Photo Above, Khew helping teach JICA's Remote Sensing of Forest Resources trainees in 2015)

History of your personal work in conservation and GIS:loading.... Involving myself in conservation and GIS today should be traced back to the years in junior high school and high school. In Malaysia, geography was a compulsory subject during junior high school years and I found myself enjoyed learning it. However, geography was no longer a compulsory subject during high school years. A few friends and I tried to request that our high school started a geography class but we were rejected as we were not able to gather a group of 10 people. Soon, I found myself started to love the subject of biology which lead me to study Conservation Biology at University Malaysia Sabah (UMS). (Photo right: Khew with Interns from University of Malaysia at the Int'l Wildlife Management Congress in 2015)

With the rich nature of Sabah, I explored many amazingly beautiful natural places and my fond of nature started to grow within myself. At the same time, I feel sad for the issues of environmental degradation and destruction that we learned. Then, from some chats with friends from business and finance students who do not have any idea about the environment, I realized the important of integrating environmental education into eco-tourism to raise awareness among the people in conserving and preserving the nature while they are enjoying the precious nature. I also chose eco-tourism for the elective loading....courses. Unfortunately, the professor expertise in eco-tourism was not around during my years at UMS’s Institute for Tropical Biology and Conservation (ITBC). Thus, I chose to study ethnobotany at a local protected area with the hope to enumerate the number of useful plants to the indigenous people for my graduation thesis. The result shows that even in a small parcel of land (a quarter hectare) has lots of useful plants which can be used for food, construction, medicine and etc. And this is important to give the value to the nature when we try to convince non-conservationists about the importance to conserve the nature. (Photo Right, Khew with her supervisor at radio interview on the work of the RGU Environmental GIS Laboratory in 2016)

As for GIS, I started to like it only during my internship at Rakuno Gakuen University (RGU) in 2013. Though I used to learn a little about it in UMS, I did not had any interest because I did not know how useful it is in various fields. This is also the reason why I worked my way here and is studying Environmental GIS in RGU. And I still have to work part time to cover the expensive living cost here in Japan. While filling up this application form, I am expecting to graduate in March 2017. For this Master Degree Dissertation, I am writing about the accessibility of national parks to people who use wheelchairs. This is because I think that a national park which is a popular location for eco-tourism, should be accessible for all and that everyone has the right to be healthy and learn more about the nature so that everyone can understand the importance of the nature, and willing to conserve and preserve the nature. Also, I am assisting undergraduate GIS classes by being a teaching assistant and whenever possible, I also assisted the JICA’s “Remote Sensing of Forest Resources”.

*-Title of the paper you will present: Can the People who Use Wheelchairs enjoy the National Parks?

*-Abstract/summary of the paper you will present: National parks are important not only to conserve and preserve the environment but also a good place for recreation and eco-tourism. As conservation and preservation need money, recreation and eco-tourism can be a good source of income as many are willing to pay for the service. With the expanding population of people with disabilities (PwDs), including the elderly due to better awareness of human right, advancement of healthcare, and the increasing aged population and traffic accidents in the world, the accessibility of national parks towards the people who use wheelchairs has become more significant. Besides, I believe that everyone, including the disabled do have the rights to enjoy the nature and they may want to involve in conservation and preservation activities as well.
Penang National Park (PNP), Taman Negara National Park (TMNP), and Kinabalu Park (KP) are chosen in this study because of their short distance to a city or they are popular or both. This study utilize descriptive research method to examine the current accessibility of people who use wheelchairs to the selected national park based on collected data. The collected data are free/open GIS data to identify the location of the parks, the accessible area, the location of facilities, services and/or experiences accessible by the people who use wheelchairs using GIS. Verification of the accessibility was done by collecting the primary data via on-site observation and telephone interview as well as secondary data from the online survey. Slope percent calculated from DEM data is used to identify the accessibility and difficulty of the road and trails to people who use wheelchairs by comparing to the accessible scales.
The least accessible distance and least accessible elevation range in the park is PNP, followed by TNNP, and KP. In Malaysia, people who use wheelchairs mostly cannot access to the parks or access with difficulties and much inconveniences as the accessible facilities such as toilets are either not provided or provided without complying with Malaysian Standard. The paved path may have numbers of obstacles that stop the use of people who use wheelchairs or threaten their safety.

more
0 0 423
ElaSegina
New Contributor II

Ela Šegina

Geological Survey of Slovenia        

( xTTT2019   x2019TTT  xScholar2013  xTTT2013  x2013Talk  xSlovenia xChapter   xGeology  xLandslide )

Researchgate Profile            SCGIS Slovenia Chapter

Dimiceva 14, 1000 Ljubljana, Slovenia, 00386 

ela.segina  at  geo-zs.si

2019 Profile:  Ela  is a participant in the first-ever SCGIS TTT Summit Meeting. 

2019 International Conference Presentation

2019 Map Gallery Interviewer TEAM MAPITAS

2013 TTT Certification: Ela received her TTT Trainer Certification in Sept 2013 at the "Second National "Conference of the Community Environmental Conservation GIS"  Conference, organized by the SCGIS Russia Chapter.  


Arcnews Article about the 2013 Scgis Russia TTT'"The three former Scholars recently trained in Russia are now ready to teach the AE class, both in terms of their skills and having the material. As they gain experience and confidence, they will add more classes to their repertoire, with the continuing support of Juniper GIS for teaching material. Over the next five years, we would expect to have as many as 300 or more people learning how to use GIS in conservation applications from these three new instructors, which is quite a multiplier effect."

Ela Šegina (Right) proudly holding her new TTT Authorized Trainer Diploma with TTT Colleagues Anna Komarova (Left) and Ilona Zuraleva (Center left):

/external-link.jspa?url=https%3A%2F%2Fwww.esri.com%2Fesri-news%2Farcnews%2Fsummer14articles%2Ftrain-...

2013 Scgis Scholar Profile

Ms Ela Šegina
Email address(es): ela.segina at gmail.com
Title or role in the organization: researcher
Organization name: Geological Survey of Slovenia
Organization full street address (in your local format): Dimičeva 14, 1000 Ljubljana
Country: Slovenia
Work phone with country and area code: 00 386 1 2809 815
Work fax with country and area code:  00 386 1 2809 753
Organization Web site URL if any: http://www.geo-zs.si/
Organization subject keywords (please see instructions): geology, analysis, karst, landslides, conservation, data integration, environmental education, landscape analysis.

John Schaeffer discusses teaching issues with Ela Šegina as Ilona Zhuravleva prepares for her lecture at the ArcGIS for Environmental Analysis class in Moscow.

The Geological Survey of Slovenia provides information about the geological setting and natural resources of Slovenia and participates in the development of knowledge about past and present processes taking place in the Earth's crust. GeoZS collects, stores, and disseminates data about the geology of Slovenia and through international cooperation with its partners abroad extends its activities over the Slovenian borders.d

The experts of the GeoZS are involved in the research, expertise and development within the frame of public services for the Slovenian government and the EU. GeoZS gives expert support and advice for geosciences related applied projects. We actively cooperate with the Slovenian universities in pre- and postgraduate educational programmes.

GeoZS is involved in research activities at home as well as abroad through the association with similar institutions and thus participates in the development of geosciences. It ensures comprehensive availability and use of knowledge for the society and industry, transfer of scientific achievements into practice, popularization of science, spreading of scientific culture and information for expert and general public.

I used a GIS as a conservation tool during my volunteering at a NGO CIPRA Slovenia, where we were developing a plan of revitalisation of the alpine lake. I was also working on a land use change in Koper, Slovenia. In my diploma thesis I performed spatial analysis of factors that cause rockfalls on coastal cliffs along the Slovenian coast and produced the geohazard susceptibility map of a large part of Slovenian coast. I participated at the conservation of a seagrass Posidonia Oceanica meadows in the Bay of Alghero, Sardinia, Italy. In my PhD thesis I performed numerous spatial analysis of karst surface features that contributed to the understanding of karst geomorphology and evolution of the karst surface on Krk Island in Croatia.

Spatial analy of karstic depressions distribution, Krk Island, Croatia.

The most challenging in my GIS work is how to use a high-tech computer tools in interpreting and understanding something as basic as the nature.

2013 Scgis Conference Paper

Title:  Use of GIS at cleaning of contaminated mountain lake in Slovenian Alps

Abstract:   Dvojno jezero (Double lake) in the valley of Triglav lakes in Julian Alps, Slovenia, was contaminated by an anthropogenic introduction of fish (Salvelinus alpinus), which has demolished the food chain. Introduced fish has eaten all planktonic crustaceans, which until then successfully controlled the growth of the algae. Additional intake of nutrients is a consequence of inappropriate water discharges from nearby cottage, which has accelerated growth of algae. Revitalisation of lake water is necessary because most of the water is discharged into the Savica river, supplying Lake Bohinj and is also the source of drinking water in the area.

The aim of this paper is to present how GIS methodologies can upgrade knowledge about water flow through mountain lakes in karst area and how GIS can accompany the revitalization of the contaminated lake. Expected outcome is data, which will help to understand the water cycle of the lake. At the same time, maps as result of this research (3-D models, thematic maps) will act as visual supporters of the project and will help to make this environmental problem more transparent and understandable for general public.

2019 Scgis Conference Paper

Title: Using spatial data for modelling landslide susceptibility

Abstract: The landslide prediction system was developed to model the probability of rainfall-induced landslides occurrence in Slovenia. It is based on the three input spatial datasets: 1) landslide susceptibility map, 2) landslide triggering rainfall threshold values and 3) precipitation forecasting model. Statistical methods have been applied in analyzing spatial correlations between several environmental factors, precipitation forecast and existing landslide inventory. Potential landslide areas are forecasted twice daily on a national scale (1: 250,000) and on a local scale (1: 25,000) for selected municipalities and are available to the Administration of Civil Protection and open public via web-platforms. The system for landslide prediction constantly upgrades by implementation of different rainfall models, new parameters and incorporation of public risk. Additional calibration of input parameters and landslide inventory as well as improved spatial resolution of rainfall forecast data will further enhance the model's prediction and improve the landslides early-warning system.

more
1 0 915
by Anonymous User
Not applicable

Great news from San Diego as Sparrow Data Solutions have announced that they are now an Esri Silver Business Partner. Sparrow specializes in working with the non-profit community to assist with GIS, mapping, and geospatial technology for such areas as monitoring the deployment of resources (like water filtration units in Africa) and they also assist in connecting the organization with donors to enable the donors to be more connected and have greater information and access to information about the cause they are helping with.

Sparrow launched in 2018 in order to help non-profit organizations collect, process, and report their work to current and potential donors using specialized GIS tools. “We recognized the growing desire of many donors to not only see where their investments are being used but also, to visualize the outcomes of their work. “Unfortunately small NGO’s sometimes struggle to access the same funding that larger NGO’s receive in order to do the critical task of Monitoring and Evaluating their work to show Sustainability. To help out we decided to create a company that can provide them with the same tools as larger NGO’s without having to hire full-time specialists.” (Martha Rodgers, co-founder, Sparrow Data)

Sparrow’s experience and flexible approach allow them to build a plan that helps non-profits effectively collect field data, make informed decisions based on the real-time state of their projects, and tell the organization’s story to potential donors. Noteworthy benefits Sparrow brings to customers:

  • Help organizations track, manage and analyze data about the work you are doing.
  • Show your impact – Quantify how your work is changing people’s lives with simple tools to set yourself apart.
  • Helping donors feel connected – Show your donors how their gifts are being invested in real-time while protecting the recipient and field team’s privacy without adding work to your team.
  • Manage Work – At a glance, know the state of your projects, what needs to be scheduled, and watch your teams work in real-time.
  • Compile and visualize statistics in real time that allow you to see trends and make informed decisions.
  • Tell your story visually – Personalized and interactive storyboards (Story Maps) that walk people through what your organization is striving to accomplish and how successful you are.
  • Help you build an Impact Statement that your donors will never forget

How Sparrow can leverage our ESRI partnership to meet your needs:

  • Web mapping with ArcGIS Online
  • Field data collection with Survey123
  • Data management, analysis and processing with ArcGIS Pro
  • Maps for your website with Story Maps
  • More!

You can learn more about Sparrow at Monitoring and Evaluation Consultants | Sparrow Data Solutions  and on Twitter @SparrowData 

Giving Liberia border to border clean drinking water – The Bucket Ministry – Recipient Mapping – See also the Last Well’s Mission story at https://www.sparrowdatasolutions.com/partner-stories

more
0 0 339
by Anonymous User
Not applicable

Several hundred SCGIS viewers recently enjoyed the Esri "Learn ArcGIS" team's first webinar offering for this Conservation GIS community.   Any who missed it can now view the webinar recording at your leisure.

"Climate change is in the news more than ever and the projected changes are characterized as dire. How will climate change impact the area where you live? This webinar will dive into the latest scientific data on climate change giving you the basis to explore how scientists project your climate will change"

more
0 0 258
by Anonymous User
Not applicable

Dr. Mervyn Charles Lötter, Certified Master Trainer

Biodiversity Planner, MTPA Research Station, SOUTH AFRICA

Mpumalanga Tourism & Parks Agency

N4 National Road, Hall's Gateway

Mataffin,  Nelspruit,  1200  SOUTH AFRICA

  (TTT Years: le19  tt18 to17 tt14 to12  yr11  ttmaster ttleader  xCommitteeInternational 2011-2019 xSouthAfrica xAfrica )

SCGIS Scholar & Trainer HISTORY:  2011, SCGIS Scholar. 

2012 Class Assistant at 2 SCGIS Conservation GIS Courses taught in South Africa.  

2014 Jan: Independent Teaching of SCGIS Conservation GIS Course at South Africa Nature Reserve

2014 Mar: Accepted as TTT Candidate for the SCGIS 2014 Scholar Training Program, Graduated Jul 2014

2017: Began work converting SCGIS Training Courses to ArcGIS Pro and adding Species Analysis content

2018 Accepted at TTT Master Candidate for the SCGIS 2018 Scholar Training Program


2011 SCGIS Scholar Profile

I live in a biodiversity rich province with over 4500 plant species and two internationally recognized centers of plant endemism (Wolkberg & Barberton Centres). We have immense pressure on the environment from the mining sector since a change in legislation resulted in all mineral rights reverting back to the state and now anybody can apply for them. We are trying to assess the potential impacts of the mining applications our department has received (nearly 40% of our province has been applied for mineral prospecting since 2005!)


   We are in process of reviewing our systematic conservation plan and need to incorporate latest land cover maps, threatened species information, etc. to develop a tool that we need to get support for from national mining industry (not just provincial Cabinet support). We therefore need to work with partners, NGOs, and the mining industry to influence policy. But from a GIS point of view I would like to include climate change considerations into the systematic conservation plan and to develop useful and easy to use spatial tools for assessing impacts and highlighting biodiversity priority areas. A tool that can consider the cumulative impact of a mine on biodiversity would be on my wish list. One of the greatest challenges is the lack of financial resources. With no money, I cannot outsource any work. But with no GIS equipment, training or software, I cannot do the work myself.  I have taught myself a lot about GIS on my own, but I am often felt wanting. I would love to learn from others working in the field and I would LOVE to receive some formal GIS training.  It would be best if I am “taught to fish, not given the fish to eat”, so it would be great if I can participate in the 2011 SCGIS software and training.


Our GIS section now falls under the section “Biodiversity Planning”. All our posts are vacant and I have been acting in the manager post of this unit since October 2008. I am the only staff member in this unit. I am a botanist with GIS skills (all self taught) and I have been ‘covering’ this post since 2005, where I developed our provinces first Systematic Conservation Plan using Marxan, called the Mpumalanga Biodiversity Conservation Plan. See http://bgis.sanbi.org/MBCP/project.asp for a copy of the report and GIS layers developed by myself and our coordinator, Tony Ferrar.  I have all the GIS responsibility for our organization (including biodiversity and tourism sections), although I lack the necessary GIS skills. I have some skills, but not enough to service our organization. As mentioned before, I have had NO formal GIS training at all. We are very cash strapped and these days work closely with NGOs such as WWF and EWT (Endangered Wildlife Trust). I try and support them with spatial biodiversity data as much as possible. If we support our NGOs, they will support us. Lastly, I have a database responsibility as well as I am responsible for supplying our scientists with databases in which they can capture, store, and query their biodiversity records (fish, invertebrates, birds, herpatopfauna, mammals, and plants). We use this species data for species distribution models (using Maxent). More importantly, this data is used in our systematic conservation plans to inform sustainable development areas and our protected area expansion spatial priorities.


Local Community Work:  Our organization has the biodiversity mandate for the province. I developed our systematic conservation plan (together with a temporary coordinator) that has been amazingly instrumental in supporting conservation actions throughout the province. We have presented our plan to our Premier (top most political figure in our province) and it was adopted by our Cabinet as a land use decision support tool. It is now used by our provinces Environmental Impact Assessment (EIA) unit to assess all EIAs received. It is similarly identifying areas where we need to expand our protected areas. Our province is 7.5 million hectares in size.


*-HISTORY  I started as a botanist using GIS to develop species distribution models to overlay models to identify priority areas for threatened plant species, this progressed to basic database management, and the development of our first aquatic and terrestrial conservation plans using a systematic conservation planning approach and Marxan (completed in 2007). I then used output to develop a land-use planning GIS using ArcExplorer 2 and spatial priority layers. This was followed by the development of our provinces first protected area expansion strategy where I determined the spatial priorities for our 20 year strategy. I am currently working on revising our systematic conservation plan by using an updated landcover, new species distribution data, planning units, freshwater priorities, threat layers, etc.


Title/Abstract of Dr. Lotter’s 2011 SCGIS Paper

“Using the Mpumalanga Biodiversity Conservation Plan in Protected Area expansion and land-use decision making in Mpumalanga Province, South Africa.”

   The Mpumalanga Biodiversity Conservation Plan (MBCP) identifies: 1) priority areas for protected area expansion; 2) priority areas for the conservation of freshwater biodiversity; and 3) priority biodiversity areas that need to be maintained in a natural state and therefore informs the land-use decision making process. In particular Listing Notice 3 of the new Environmental Impact Assessment regulations requires the identification of important geographic areas. The MBCP is based on a systematic conservation planning approach that follows a series of steps and requires key biodiversity and spatial information layers. These layers and their targets are analysed in Marxan to identify the most efficient portfolio of planning units necessary to meet biodiversity targets. The output is a map of biodiversity options or flexibility. Systematic conservation planning is an iterative process and through the various revisions of the MBCP, it will be further refined and improved to become an even more useful core biodiversity planning instrument for Mpumalanga Province, South Africa.

more
0 0 1,158
by Anonymous User
Not applicable

This is the end of a challenging year for those of us who work in conservation.  It's a tough calling, most of the news is bad, most of the time the odds are against us. Today the folks helped start the Society for Conservation GIS gave California and the world the incredible gift of protecting 24,000 acres of central california coastline, one of the last great stretches of undeveloped coastal wildlands.  Thank you Jack & Laura Dangermond! 

Jack & Laura Dangermond Preserve Video   

National Geographic Article

more
1 0 319
by Anonymous User
Not applicable

SCGIS 2016 International Conference, INDIGENOUS & COMMUNITY BASED CONSERVATION SESSION

Vivian Banci, Banci Consulting Ltd.Vivian Banci
“The Role of Inuit Traditional Knowledge in Evaluating Potential Mining Developments"   

“The Role of Inuit Traditional Knowledge in Evaluating Potential Mining Developments"

"Climate change research continues to show that storms are intensifying, sea levels are rising, and areas are becoming more susceptible to flooding. In fact, the Boston Harbor Association ?Preparing for the Rising Tide Report? states that preparedness plans need to be implemented to account for future increases in flooding. As a result, National Grid is taking a proactive stance to implement flood protection measures at substations in MA and RI to allow the continuous, reliable delivery of electric service in light of future increases in flooding and storm events. In order to identify the high risk substations in MA and RI, BSC prepared various map sets including hurricane storm surge locations, sea level rise and coastal impact, limit of moderate wave action, and environmental resources. This preliminary GIS effort assisted National Grid in their planning, design, and permitting of temporary flood protection measures. In total, 26 substations have been chosen for upgrades to address the potential for future climate change impacts. BSC is now working to provide site specific inundation mapping, including sea level rise and storm surge, as National Grid begins to design permanent flood protection measures. These maps will take into account site specific criteria including topography, mean high water line, high water marks, and tides. Different scenarios, such as variations in sea level rise and hurricane categories, will be evaluated to create the resilient design solutions."

more
0 0 246
by Anonymous User
Not applicable

A new storymap about the threat of climate change to both traditional and natural resources has been released by The Samish Indian Nation Dept. of Natural Resources, with help from their GIS and Climate Adaptation teams.  It's a fascinating look at the rich history & diversity of cultural and natural resources of the Samish Nation, the impact of climate change on those resources, and what the viewer can do about it.  It's a nicely done example of Mapping for Advocacy, creating a compelling story that ends with specific actions that the viewer can undertake to help.

more
0 0 248
11 Subscribers