- Home
- :
- All Communities
- :
- Products
- :
- ArcGIS Velocity
- :
- ArcGIS Velocity Questions
- :
- Re: Big Data Analytic - Summarize by Year or Quart...
- Subscribe to RSS Feed
- Mark Topic as New
- Mark Topic as Read
- Float this Topic for Current User
- Bookmark
- Subscribe
- Mute
- Printer Friendly Page
Big Data Analytic - Summarize by Year or Quarter etc
- Mark as New
- Bookmark
- Subscribe
- Mute
- Subscribe to RSS Feed
- Permalink
I have a big data analytic that is summarizing statistics for a real-time data feed database where data in the database is from 2020-current. I'd like to summarize the data by year, quarter, etc so eventually it would run every week or something. However, I can't seem to figure out how to do that. Summarize within doesn't seem to have a "summarize by" distinct values. When I run it - I just get one row of data for all the years. Any suggestions? Is this possible in ArcGIS Velocity? Looks like the Summary fields type of (Any) option just pushes a random entry through.


Olmsted County GIS
GIS Analyst - GIS Solutions
Solved! Go to Solution.
Accepted Solutions
- Mark as New
- Bookmark
- Subscribe
- Mute
- Subscribe to RSS Feed
- Permalink
Hi @Teresa_Blader is your goal to do a spatial summary by year (multiple counties, different results for each county)? Or are you just trying to do summary analysis on attributes based on time like year.
If the latter, from what I can see, I might propose the following:
- Add a Calculate Fields tool to calculate fields such as "Year" and "Year_Quarter" like "2024" and "2024-Q1" values
- Now that your feature schema has attribute values to reflect Year or other date value, you can proceed
- Add a "Summarize Attributes" tool
- You would set the Group fields value to a field like "Year" or "Year_Quarter"
- Configure your desired summary fields for statistical analysis
- Now, with a group field of year, the summary fields you configure will be calculated for each unique value present within the group fields
- 2020, 2021, 2022, 2023, 2024, etc.
- If there were 5 years of data, there would be 5 records coming out of the Summarize Attributes tool
The Summarize Within tool is used to summarize and calculate attribute values of the records that fall within various spatial boundaries.
- Mark as New
- Bookmark
- Subscribe
- Mute
- Subscribe to RSS Feed
- Permalink
Thanks!! That seemed to get me where I needed to be, just had to add the geometry with Map Fields which worked since each area is for the same location.

Olmsted County GIS
GIS Analyst - GIS Solutions
- Mark as New
- Bookmark
- Subscribe
- Mute
- Subscribe to RSS Feed
- Permalink
Hi @Teresa_Blader is your goal to do a spatial summary by year (multiple counties, different results for each county)? Or are you just trying to do summary analysis on attributes based on time like year.
If the latter, from what I can see, I might propose the following:
- Add a Calculate Fields tool to calculate fields such as "Year" and "Year_Quarter" like "2024" and "2024-Q1" values
- Now that your feature schema has attribute values to reflect Year or other date value, you can proceed
- Add a "Summarize Attributes" tool
- You would set the Group fields value to a field like "Year" or "Year_Quarter"
- Configure your desired summary fields for statistical analysis
- Now, with a group field of year, the summary fields you configure will be calculated for each unique value present within the group fields
- 2020, 2021, 2022, 2023, 2024, etc.
- If there were 5 years of data, there would be 5 records coming out of the Summarize Attributes tool
The Summarize Within tool is used to summarize and calculate attribute values of the records that fall within various spatial boundaries.
- Mark as New
- Bookmark
- Subscribe
- Mute
- Subscribe to RSS Feed
- Permalink
Both, but just for one county - so it still is associated to a county boundary polygon, but I am trying to summarize by the year and quarter.... I suppose I could just do tabular data though. Probably why I didn't try the summarize attributes tool! I'll give that a try.
Olmsted County GIS
GIS Analyst - GIS Solutions
- Mark as New
- Bookmark
- Subscribe
- Mute
- Subscribe to RSS Feed
- Permalink
Thanks!! That seemed to get me where I needed to be, just had to add the geometry with Map Fields which worked since each area is for the same location.
Olmsted County GIS
GIS Analyst - GIS Solutions
- Mark as New
- Bookmark
- Subscribe
- Mute
- Subscribe to RSS Feed
- Permalink
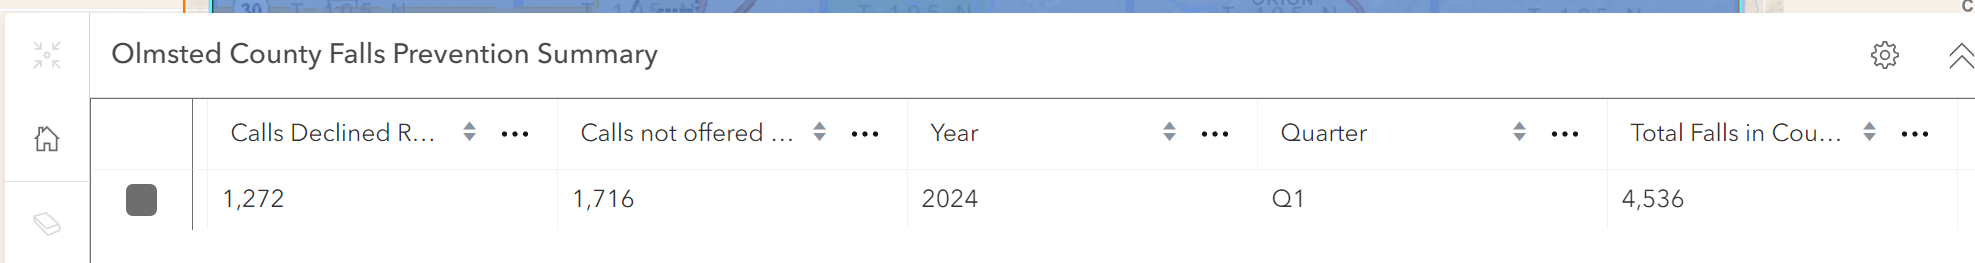
Now that I got this working, just wanted to share the dashboard I made using this workflow - instead of using the feed data which would have exposed public health information like name, date of birth, and address - I am able to summarize the data at the county level by year, quarter, and week which is shared with the public 🎉
https://www.arcgis.com/apps/dashboards/5f94573ed8da4cb5a07ec3c01907fb24
Things I learned:
1. Categorical Data is kind of painful to summarize from the feed, but with arcade and the iff function I made it through. Each record essentially got a 1 if it contained this category or 0 if it didn't. So a new field for each category I summarized.
2. I originally created a view off of the final output in AGOL, and had that connected to the dashboard, however the view quickly breaks if you are replacing the features and the schema when it runs and do any changes to the database, like adding more category fields. I would do that differently, but can't seem to change that setting after Velocity has created that new output feature layer... assuming that the other settings wouldn't cause the view to break.
Olmsted County GIS
GIS Analyst - GIS Solutions