- Home
- :
- All Communities
- :
- Products
- :
- ArcGIS Pro
- :
- ArcGIS Pro Questions
- :
- How to Change # of Decimal Places in Chart Statist...
- Subscribe to RSS Feed
- Mark Topic as New
- Mark Topic as Read
- Float this Topic for Current User
- Bookmark
- Subscribe
- Mute
- Printer Friendly Page
- Mark as New
- Bookmark
- Subscribe
- Mute
- Subscribe to RSS Feed
- Permalink
When I right-click on a field within the attribute table and select 'Statistics', a chart and statistical properties appear. I wish a small, simple window would come up with statistical information instead of a full separate entity - as was the case in ArcMap - but that is neither here nor there! Right now, the various statistics (sum, max, mean, etc) only show 1 decimal place. The numeric properties for the field itself are set to show 6 decimal places and I don't see where I can change this property for the chart results. I'd like for more than 1 decimal place to be present. Does anyone know how to change this??
- Mark as New
- Bookmark
- Subscribe
- Mute
- Subscribe to RSS Feed
- Permalink


You can change all the chart properties.... just not the tabular summary.
... sort of retired...
- Mark as New
- Bookmark
- Subscribe
- Mute
- Subscribe to RSS Feed
- Permalink
@DanPatterson - I noticed that as well. The number format can be changed for the chart like your screenshot shows. What's weird is that I've come across other screenshots of the 'Data' view which show more than 1 decimal place so it has to be doable somehow. I'm not sure how just showing the tenths place is deemed sufficient.
- Mark as New
- Bookmark
- Subscribe
- Mute
- Subscribe to RSS Feed
- Permalink
probably because it is just a quick view and probably isn't meant to be a proper summary table. There are lots of other ways to get a statistical summary for reports.
... sort of retired...
- Mark as New
- Bookmark
- Subscribe
- Mute
- Subscribe to RSS Feed
- Permalink
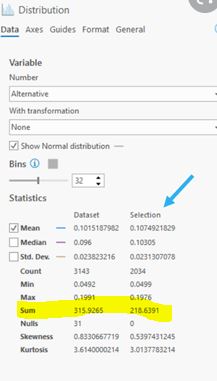
@DanPatterson Yeah, I agree that it isn't meant to be anything "proper". However, I don't really use it for reports, it's just a convenient way to do quick QC which is how I use the function. It rounding to the tenths isn't very conducive anymore. If you look at the image I'm attaching (found it online), there does seem to be a way to adjust this...just not sure how!
- Mark as New
- Bookmark
- Subscribe
- Mute
- Subscribe to RSS Feed
- Permalink
I agree with @ChristopherBowering because I use that information for quick QC or a quick answer for someone ("Hey, can you tell me how many feet of pipe are along that stretch of street we were just discussing?").
Not a solution but a workaround: If you right-click the value and copy it you can then paste it into a text file, email, etc. and it retains all of the decimal places. So it is just a short-sighted decision during development regarding how many decimals to display with no way for us to modify it. I wish they would at least honor the unit format settings one can set in the Options for Pro.
- Mark as New
- Bookmark
- Subscribe
- Mute
- Subscribe to RSS Feed
- Permalink
Thank you for the workaround suggestion! That is good to know. I miss the ease of viewing statistics in ArcMap when it just gave you a quick summary; no charts, graphs, etc.
- Mark as New
- Bookmark
- Subscribe
- Mute
- Subscribe to RSS Feed
- Permalink
I completely agree. I use the statistics frequently for QC purposes and I need more decimal places. I don't want to have to generate a new summary table just to get the sum of a column. And most of the time, the charts are unnecessary clutter for me. I wish there were two options in the right-click menu, one for simple statistics and one for statistics and charts. And I wish we could specifiy how many decimal places we want to see.
- Mark as New
- Bookmark
- Subscribe
- Mute
- Subscribe to RSS Feed
- Permalink
So... while in-person at the Esri UC a few weeks ago I took the opportunity to "gripe" about this issue at the Pro product island. I had nothing but great interaction and engagement with Alycia regarding three topics we discussed, of which this was one. She briefly left and came back with another employee who could shed some insight on this particular issue.
It turns out that this other employee (I won't name but he was great as well, seriously!) was the person that argued for changing it to one decimal place (who could have predicted that?). His reasons were sound, though shortsighted (my opinion).
I requested a reversal to 6 decimal places (quick, easy, not much testing) or, better, an option for us to specify the number of decimals shown (obviously more development and testing).
While he made no absolute promises, he sounded positive that they could just revert back to 6 decimals. I think they just didn't realize how people are using that information. It will be discussed by the Charts team. If it happens, we likely won't see it until Pro 3.1.
I'm keeping my fingers crossed, but I'll believe it when I see it!
- Mark as New
- Bookmark
- Subscribe
- Mute
- Subscribe to RSS Feed
- Permalink
Thank you for advocating this issue on our behalf! It's great that you were able to have a detailed discussion about such a minor feature. I really don't know how it could 'hurt' to have the option for multiple decimal places so hopefully it can be reverted back as you mentioned. I'm sure careful thought goes into most changes ESRI makes but I agree that this one was probably short sighted. Thanks!