- Home
- :
- All Communities
- :
- Products
- :
- ArcGIS Pro
- :
- ArcGIS Pro Questions
- :
- Re: Debugging a Python Toolbox using Visual Studio...
- Subscribe to RSS Feed
- Mark Topic as New
- Mark Topic as Read
- Float this Topic for Current User
- Bookmark
- Subscribe
- Mute
- Printer Friendly Page
Debugging a Python Toolbox using Visual Studio Code
- Mark as New
- Bookmark
- Subscribe
- Mute
- Subscribe to RSS Feed
- Permalink
I found the docs on using Visual Studio and PyCharm but I wonder if anyone has had success with Visual Studio Code?
I set up launch.json and I can attach to ArcGISPro.exe but I am not sure what comes after that. I can set breakpoints in my .py file from the IDE but they are never hit.
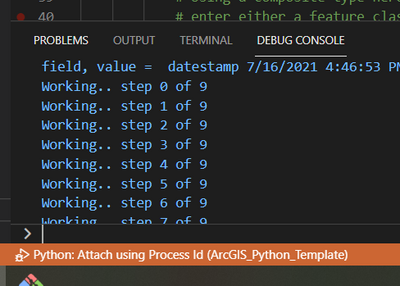
I use F5 to run and wait for the status bar to go orange which indicates it's running. I must be very close, because I can see print() statement output in the IDE's Debug Console window.
I am running ArcGIS Pro 2.8 on Windows 10 using the newest VS Code.
If you are interested in seeing the Python code, it's here
https://github.com/Wildsong/ArcGIS_Python_Template
My launch.json looks like this
{
  "version": "0.2.0",  "configurations": [
    {
      "name": "Python: Attach using Process Id",
      "type": "python",
      "request": "attach",
      "processId": "${command:pickProcess}"
    },
    {
      "name": "Python: Current File",
      "type": "python",
      "request": "launch",
      "program": "${file}",
      "console": "integratedTerminal"
    }
  ]
}
Happy Friday!
- Mark as New
- Bookmark
- Subscribe
- Mute
- Subscribe to RSS Feed
- Permalink
Hi Brian,
Did you ever find a resolution to this? I'm in the same boat currently. Thanks.
- Mark as New
- Bookmark
- Subscribe
- Mute
- Subscribe to RSS Feed
- Permalink
what worked for me
1. run ArcGIS pro (3.0)
2. open vs code with the script open
3. in vs code run and Debug , then select attach using process ID
and select the ArcGIS pro processed
run the gp tool in ArcGIS pro
- Mark as New
- Bookmark
- Subscribe
- Mute
- Subscribe to RSS Feed
- Permalink
Doesn't seem to work for me. It seems to attach but it runs in AGP without hitting the breakpoints.
I tried a couple different routes:
1. Debug on the tool script
2. Debug on the toolbox (pyt)
3. Removing and re-adding the toolbox.
I get the debug pane in VS (variables, call stack, etc) but no breakpoints. How is your toolbox laid out?
- Mark as New
- Bookmark
- Subscribe
- Mute
- Subscribe to RSS Feed
- Permalink
since the move to arcPro 3
its not working as expected
- Mark as New
- Bookmark
- Subscribe
- Mute
- Subscribe to RSS Feed
- Permalink
For me it does work with debugpy breakpoints but not with visualstudio breakpoints. For using debugpy import debugpy in your python tool file (.pyt) :
import debugpy
on those lines where you want the debugger to stop, call debugpy's breakpoint() method:
debugpy.breakpoint()
Then run and debug add a debug configuration that let's you pickup the Process ID of the running ArcGIS Pro application:
 {
            "name": "Python: Attach using Process Id",
            "type": "python",
            "request": "attach",
            "processId": "${command:pickProcess}",
            "justMyCode": true
 }
Start debugging, wait for the debugger to connect and then run the Python Tool in ArcGIS Pro. The debugger will stop wherever the debugpy.breakpoint() call was set.
- Mark as New
- Bookmark
- Subscribe
- Mute
- Subscribe to RSS Feed
- Permalink
I have taken to running the tools outside AGP entirely. It has sped up development by sidestepping the 'reload toolbox' requirement. That said, I would still like to get this going if anyone finally cracks this.
- Mark as New
- Bookmark
- Subscribe
- Mute
- Subscribe to RSS Feed
- Permalink
I've just come across this post after searching for the solution for a while, this was the closest I got as well. I can see print commands but can't see any of the variables or watched expressions. Anyone managed to get this working in the last year?
- Mark as New
- Bookmark
- Subscribe
- Mute
- Subscribe to RSS Feed
- Permalink
I used this blog, which helped me create a .py file that I can use with vs code to debug using the default launch.json:
https://www.esri.com/arcgis-blog/products/arcgis-desktop/analytics/how-to-debug-python-toolboxes-in-...
here are other resources that might be of interest:
https://mfcallahan.blog/2022/10/11/configuring-vs-code-for-arcpy-arcgis-pro-development/
https://github.com/microsoft/debugpy/issues/431
- Mark as New
- Bookmark
- Subscribe
- Mute
- Subscribe to RSS Feed
- Permalink
Hi, you might be interested in hearing that we've just released the ArcGIS Pro Debugger Extension for Visual Studio Code on the Visual Studio Code Marketplace!
ArcGIS Pro Debugger - Visual Studio Marketplace
This extension allows debugging ArcGIS Pro script tools (.atbx, .pyt) using Visual Studio Code (VSC).
Our aim is to provide developers a seamless workflow to attach VSC to the Python process live in ArcGIS Pro. This integration allows developers to leverage VSC's native Python debugging experience while developing script tools for ArcGIS Pro.
- Easily attach to ArcGIS Pro and stand-alone Python processes
- Debug ArcGIS Pro Script Tools (.atbx) and Python Toolboxes (.pyt)
- Debug code on the local machine or remotely on a different machine
If you use the extension and run into any issues, you can log an issue in our public repository,
Esri/arcgispro-vscode-debugger
Additional resources:
Debug Python code—ArcGIS Pro | Documentation
