- Home
- :
- All Communities
- :
- Products
- :
- ArcGIS Pro
- :
- ArcGIS Pro Questions
- :
- Re: Count of addresses within a dissemination bloc...
- Subscribe to RSS Feed
- Mark Topic as New
- Mark Topic as Read
- Float this Topic for Current User
- Bookmark
- Subscribe
- Mute
- Printer Friendly Page
Count of addresses within a dissemination block
- Mark as New
- Bookmark
- Subscribe
- Mute
- Subscribe to RSS Feed
- Permalink
Hello all,
Newbie here. I have a table of addresses that I have geo-coded on a World Street Map. I've also included 2 StatsCan boundary files, Dissemination Subdivision and Dissemination Blocks. I am trying to use Graduated colours get a display based the count of addresses within a Dissemination Block. I've used a spatial join on Dissemination Subdivision and Join_Count for Primary symbology - Graduated Colors, and this seems to return reasonable results, but when I try the same methodology for the Block level, I get 0 for a Join_Count. Any assistance would be greatly appreciated.
Solved! Go to Solution.
Accepted Solutions
- Mark as New
- Bookmark
- Subscribe
- Mute
- Subscribe to RSS Feed
- Permalink
Oh I had fun with this one...
My best guess is that the huge number of 0 join_count values in the dataset basically overmatches the small number of other join_counts, maybe a skip factor or something like that is hidden in there. Definitely something for esri to look into.
If you get rid of the 0 values either via deletion (select by attribute where "Join_Count" = 0 or with a definition query "Join_Count" <> 0, then overlay that layer on top it should work as expected.
- Mark as New
- Bookmark
- Subscribe
- Mute
- Subscribe to RSS Feed
- Permalink
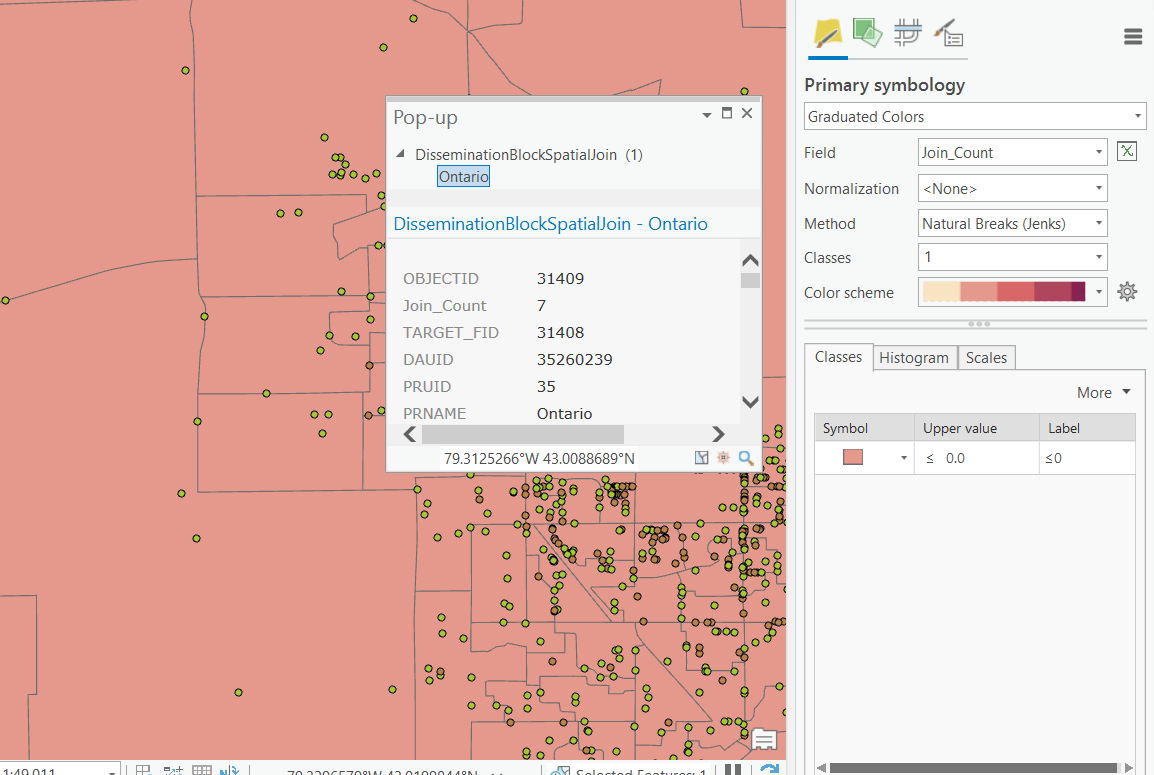
Please see below a spatial join on dissemination block using DAUID and First as the parameters. I've selected 1 block and I can see a Join_Count of 7:
Here is a screen shot for another, more heavily populated block with a Join_Count of 85:

So I am getting differing values, per block that look reasonable (need to figure out how to validate that), but I cannot seem to get the graduated colors to display it properly. When I try to a different value for Classes (e.g., 5) it snaps back to 1 class??
- Mark as New
- Bookmark
- Subscribe
- Mute
- Subscribe to RSS Feed
- Permalink
What does the histogram look like and also can you show the attribute table including all the columns.
- Mark as New
- Bookmark
- Subscribe
- Mute
- Subscribe to RSS Feed
- Permalink
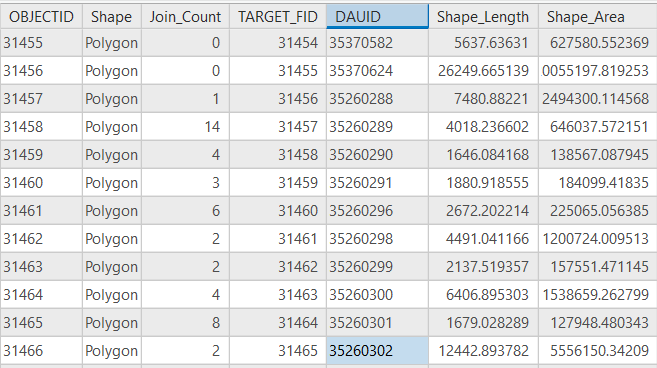
I cleaned up my spatial join a bit. Below is some sample data from the attribute table:
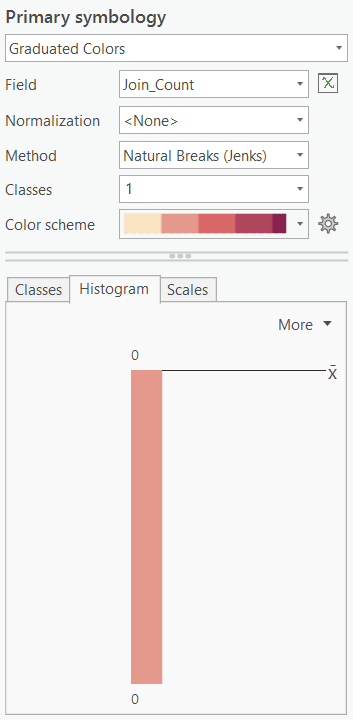
And the histogram:
Thank you,
--sue
- Mark as New
- Bookmark
- Subscribe
- Mute
- Subscribe to RSS Feed
- Permalink
Looking at your screenshots, you are doing a graduated color with one class using natural breaks. What are you expecting from a single-class graduated ramp?
- Mark as New
- Bookmark
- Subscribe
- Mute
- Subscribe to RSS Feed
- Permalink
Hi Joshua,
When I tried to select more classes, it would snap back to 1 effectively removing the option
- Mark as New
- Bookmark
- Subscribe
- Mute
- Subscribe to RSS Feed
- Permalink
Ah, OK, now I understand. With any histogram, the tool never defaults to sampling the entire set of values. That said, the symbology tool should handle your type of situation better.
- Mark as New
- Bookmark
- Subscribe
- Mute
- Subscribe to RSS Feed
- Permalink
I can't really see why it would do this other than a bug. I'd give creating a new field a try and copying the same join_count values across in field calculator, then perhaps saving a new copy. I can also try and run it for you if you send the data.
- Mark as New
- Bookmark
- Subscribe
- Mute
- Subscribe to RSS Feed
- Permalink
Thanks David. I'll try the field copy. I'm also going to try the same type of mapping with a different data set, some Ontario schools (Ontario public school contact information - May 2020 - Ontario Data Catalogue ). Unfortunately the data I am working with is sensitive and I am not able to share it. The boundary file is the Dissemination Blocks file - Cartographic boundary file found at 2016 Census Boundary files , if you were inclined to mimic the process. I'll report back if I have the same issue. If so, it is a bug or I have a bad install. If not, there is something funky with my data.
Thanks for all of your help so far
--sue