- Home
- :
- All Communities
- :
- Products
- :
- ArcGIS Pro
- :
- ArcGIS Pro Ideas
- :
- Add Trend Analysis Tool in ArcGIS Pro
- Subscribe to RSS Feed
- Mark as New
- Mark as Read
- Bookmark
- Follow this Idea
- Printer Friendly Page
Add Trend Analysis Tool in ArcGIS Pro
- Mark as New
- Bookmark
- Subscribe
- Mute
- Subscribe to RSS Feed
- Permalink
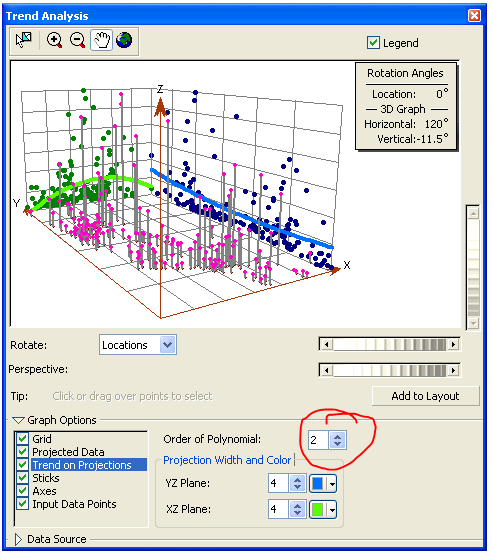
Within ArcMap we can view trends in data, using the trend analysis tool with the geostatistical analyst license. There is an image of what I am talking about here: Trend analysis—Help | ArcGIS Desktop . This was asked about by @VictoriaAnderson1 back in March of 2018. JacobHelfman1 agreed in 2020 and @KoryKramer suggested that it be added as an idea, despite being on the development team's radar. see original discussion: Trend analysis in ArcPro - Esri Community
I searched Ideas. Doesn't seem like anyone ever filed an idea for demand tracking. So here it is!
USGS has many scientists that need this tool in order to move from ArcMap to Pro. Not having it in Pro adds to the list --- that keeps our users from moving to or even trying out ArcGIS Pro! If there has been development, and it does exist in a specified toolbox, please share. Doc online seems to only note the "Trend Analysis" tool with graph viewing interface as a thing in ArcMap only! UPVOTE this if you want it in Pro!

yea... 12 yeas, no nays thus far, counting thumbs
I need this for research and for teaching. We have moved to ArcGIS Pro and I don't like saying things like "ArcMap had this awesome tool, but seemingly ArcGIS Pro does not". I'd like to vote for Tracking Analyst too.
I would like to re-iterate my support for putting trend analysis in arcpro.
This has been included in the product plan for ArcGIS Pro 3.4. The reimplementation will be a geoprocessing tool that creates a customized scatter plot chart on a feature layer that displays the projected scatterplot and trend line of the XZ plane.
In ArcGIS Pro 3.3, you can create this scatter plot manually with customized Arcade code using these steps:
- On a feature layer, create a scatter plot chart by right-clicking the layer -> Create Chart -> Scatter Plot.
- In the Chart Properties pane, for the "Y-axis Number", provide the analysis field.
- In the "X-axis Number", click the "Set an expression" button to the right of the pulldown menu.
- Paste the Arcade code at the end of this post into the "Expression" code block (make sure that the "Language" at the top is set to "Arcade"). Change the second line of the code to any desired direction. The direction is provided as degrees clockwise from North. For example, 0 is north, 90 is east, 180 is south, and 270 is west. Click OK.
- The directional trend scatter plot will be displayed in the Chart pane. You can click "Set an expression" button again and change the direction, and the scatter plot will update to show the trend in the new direction.
- To show the polynomial trend line in the scatter plot, check the "Show trend line" checkbox in the Chart Properties pane, choose "Polynomial" from the dropdown, and provide a desired "Trend Order".
// Input direction as clockwise degrees from north
var angleFromNorth = 0;

// Convert direction to counterclockwise radians from east
var adjustedAngleDegrees = 90 - angleFromNorth;
var adjustedAngleDegrees = adjustedAngleDegrees%360;
var angleInRadians = adjustedAngleDegrees * PI / 180;

// Return x-coordinate of rotated coordinate system
return Centroid($feature).X * Cos(angleInRadians) + Centroid($feature).Y * Sin(angleInRadians)
The idea has been implemented in ArcGIS Pro 3.4 as the Directional Trend tool, available in the Geostatistical Analyst toolbox (Utilities toolset) and Spatial Statistics toolbox (Measuring Geographic Distributions toolset). The tool re-creates the polynomial trend lines on the X-Z axis as a scatter plot chart on a feature layer. The tool is available at all license levels (a Geostatistical Analyst license is not required).
Upvoted!
You must be a registered user to add a comment. If you've already registered, sign in. Otherwise, register and sign in.