- Home
- :
- All Communities
- :
- Products
- :
- ArcGIS Online
- :
- ArcGIS Online Questions
- :
- Add a New Var w/o New Layer
- Subscribe to RSS Feed
- Mark Topic as New
- Mark Topic as Read
- Float this Topic for Current User
- Bookmark
- Subscribe
- Mute
- Printer Friendly Page
Add a New Var w/o New Layer
- Mark as New
- Bookmark
- Subscribe
- Mute
- Subscribe to RSS Feed
- Permalink
Very new to ArcGIS so sorry if this is a dumb question.
We are trying to add a new variable to a series of maps that have already been created, formatted, etc. I have tried doing this by merging the new variable using our unique key in "Append Data" but am unable to see the new variable in the var list when I do that. Any ideas? Using Arcade.
- Mark as New
- Bookmark
- Subscribe
- Mute
- Subscribe to RSS Feed
- Permalink
Hi Lindsey Whittington ,
It is not entirely clear what you are trying to achieve and to avoid jumping to conclusions can you clarify:
- When you talk about a series of maps are that indeed maps or are you referring to a series of layers that contain the actual data?
- When you mention "merging a new variable" are you trying to add an attribute to the layer(s)?
- You mention "Append Data" using an unique key. Append will add additional rows/features to the data, but not attributes (fields/columns). This you could do using Join.
- When you mention "var list" do you mean the list of fields?
- You mention "Using Arcade". Are you trying to create dynamic content obtaining additional information from other layers using Arcade?
- Mark as New
- Bookmark
- Subscribe
- Mute
- Subscribe to RSS Feed
- Permalink
Hey Xander -
Right now the data is in a transposed format, with all date values (data from 2009 to 2019) in a single column and all values associated with each year in a separate column. I transposed the data so I could get the data to be time aware, so the map is currently using the time slider element. I am having a hard time now displaying all the different years of data (2009: 10%, 2010: 11%. etc/) in the pop ups. I was trying to label the features in Arcade by using either a concatenation or a when operator, but I couldn't figure out how to get all years to display as you toggle through the different years of the data.
The next thing we tried as to use append to add the labels as a text field into the existing layer instead of joining the data to export an entirely new layer, which would require re-visualizing all the layers we have right now. Is there a way you know that you can add new columns of data, either by coding or by a join, that does result in an entirely new layer being created from the join?
I hope this helps clarify. Let me know if you have any additional questions!
- Mark as New
- Bookmark
- Subscribe
- Mute
- Subscribe to RSS Feed
- Permalink
Hi Lindsey Whittington ,
Thanks for clarifying! I do have a couple of additional questions/observations:
- What type of geometry does your data have (are you working with points, lines or polygons)?
- Do features with the same location have an ID that can be used to identify them?
- When creating a label you will only have access to your current feature.
- A pop-up can contain statistical information on all the features.
It would help to have access to the data. If you can share the data, please create a group, share the data with that group and invite me using my AGOL user name "xbakker.spx".
- Mark as New
- Bookmark
- Subscribe
- Mute
- Subscribe to RSS Feed
- Permalink
Hey Xander Bakker,
I am working with polygons. Right now, since I transposed the data, the unique IDs for each observation reiterate 6 times, corresponding to the 6 different years of data. It kind of seems like when I shift through the time slider, the year that I am viewing is = TRUE, almost like the other years are not accessible, at least when configuring the pop ups?
Thanks for helping with this - I'll create a group and add you!
Lindsey
- Mark as New
- Bookmark
- Subscribe
- Mute
- Subscribe to RSS Feed
- Permalink
Hi Lindsey Whittington ,
Just to know if I am on the right track have a look at the green text in the image below:
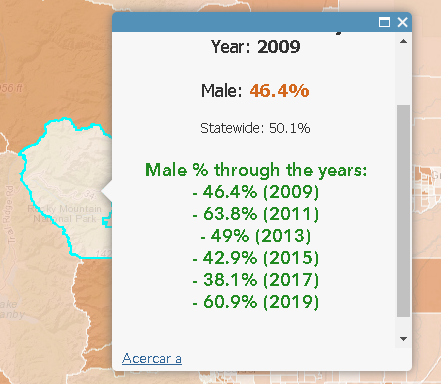
What I do, is using the geoid_1 field to identify the location and then filter the layer using this geoid_1 and loop through the results to show the final values through the years. Are you looking for something like this or do you want to extract statistics of the data?
The expression I used was:
// read out the location ID
var geoid = $feature["geoid_1"];
// create a query with that ID
var sql = "geoid_1 = @geoid";
// filter the data using the query
var fs = OrderBy(Filter($layer, sql), "State_Year ASC");
// get the count, and only process if you have results
var result = "Male % through the years:";
var cnt = Count(fs);
if (cnt > 0) {
// loop through results
for (var f in fs) {
result += TextFormatting.NewLine + " - " + Round(f["Value_Final"], 1) + "% (" + f["State_Year"] + ")";
}
}
return result;
- Mark as New
- Bookmark
- Subscribe
- Mute
- Subscribe to RSS Feed
- Permalink
Hey Xander Bakker,
This is exactly what we needed! You are a lifesaver! I have a "missing" value denoted as -1 in the data. Is there a way to integrate an expression that would make that appear as "Data Not Available" within this code? Would it appear in the result section at the end?
Lindsey
- Mark as New
- Bookmark
- Subscribe
- Mute
- Subscribe to RSS Feed
- Permalink
Hi Lindsey Whittington ,
Sure, you can put in a condition that checks for the -1 value:
// read out the location ID
var geoid = $feature["geoid_1"];
// create a query with that ID
var sql = "geoid_1 = @geoid";
// filter the data using the query
var fs = OrderBy(Filter($layer, sql), "State_Year ASC");
// get the count, and only process if you have results
var result = "Male % through the years:";
var cnt = Count(fs);
if (cnt > 0) {
// loop through results
for (var f in fs) {
var finalval = f["Value_Final"];
if (finalval == -1) {
result += TextFormatting.NewLine + " - Data Not Available (" + f["State_Year"] + ")";
} else {
result += TextFormatting.NewLine + " - " + Round(f["Value_Final"], 1) + "% (" + f["State_Year"] + ")";
} }
}
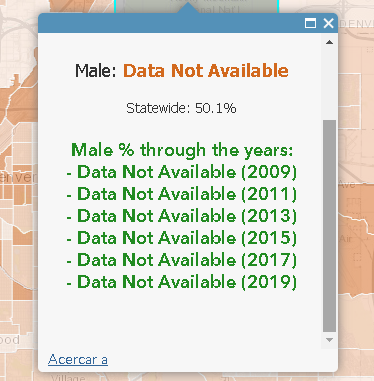
return result;Which will show up like this:
Maybe that is not what you want and you can do it differently by switching off including any results that have no data available (see line 16 which has been commented out):
// read out the location ID
var geoid = $feature["geoid_1"];
// create a query with that ID
var sql = "geoid_1 = @geoid";
// filter the data using the query
var fs = OrderBy(Filter($layer, sql), "State_Year ASC");
// get the count, and only process if you have results
var result = "Male % through the years:";
var cnt = Count(fs);
if (cnt > 0) {
// loop through results
for (var f in fs) {
var finalval = f["Value_Final"];
if (finalval == -1) {
// result += TextFormatting.NewLine + " - Data Not Available (" + f["State_Year"] + ")";
} else {
result += TextFormatting.NewLine + " - " + Round(f["Value_Final"], 1) + "% (" + f["State_Year"] + ")";
} }
}
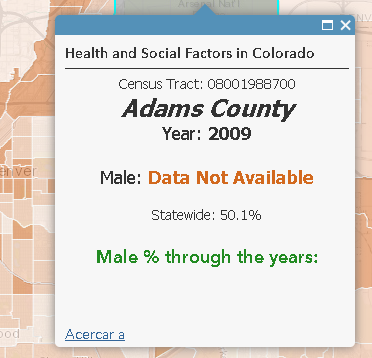
return result;This will look like this which is not very helpful either:
So you can handle those cases differently like this (in case you have census tract with part data and part no data. In this case you will collect all the years without data and add that list to the result:
// read out the location ID
var geoid = $feature["geoid_1"];
// create a query with that ID
var sql = "geoid_1 = @geoid";
// filter the data using the query
var fs = OrderBy(Filter($layer, sql), "State_Year ASC");
// get the count, and only process if you have results
var nodatayears = [];
var result = "Male % through the years:";
var cnt = Count(fs);
if (cnt > 0) {
// loop through results
for (var f in fs) {
var finalval = f["Value_Final"];
if (finalval == -1) {
// result += TextFormatting.NewLine + " - Data Not Available (" + f["State_Year"] + ")";
nodatayears[Count(nodatayears)] = f["State_Year"];
} else {
result += TextFormatting.NewLine + " - " + Round(f["Value_Final"], 1) + "% (" + f["State_Year"] + ")";
} }
}
if (Count(nodatayears) > 0) {
result += TextFormatting.NewLine + " - Data Not Available for years: " + Concatenate(nodatayears, ", ");
}
return result;Which will look like this:

- Mark as New
- Bookmark
- Subscribe
- Mute
- Subscribe to RSS Feed
- Permalink
Hey Xander Bakker,
Thanks for sending a couple different options! I think we should be able to use either the last or second to last result on the pop ups to get what we want - is it okay if I reach out if I have any additional questions? I'm going to start integrating this into my other layers!
Thanks again!
Lindsey
- Mark as New
- Bookmark
- Subscribe
- Mute
- Subscribe to RSS Feed
- Permalink
Hi WhittingtonL_cohealthinst ,
Sure, no problem!