- Home
- :
- All Communities
- :
- Developers
- :
- JavaScript Maps SDK
- :
- JavaScript Maps SDK Questions
- :
- Re: Return Results Options
- Subscribe to RSS Feed
- Mark Topic as New
- Mark Topic as Read
- Float this Topic for Current User
- Bookmark
- Subscribe
- Mute
- Printer Friendly Page
- Mark as New
- Bookmark
- Subscribe
- Mute
- Subscribe to RSS Feed
- Permalink
I have an app that has a few different queries that query the same data...it then places this data in DIV
<div id="inforesults">Results:</div>
Everything seems to be working fine I just desire more functionality. What I would like to do is:
- Move the data into a table format that has sorting
- Allow the user to select a record and highlight the map and visa versa.
Just not sure where to go from here. What are my options for a results container that would achieve this. Maybe something that I can easily stylize with CSS
// QUERY FOR County and Squad
var queryTask = new QueryTask("https://xxxx/arcgis/rest/services/Projects/xxxx/FeatureServer/5");
var query = new Query();
query.outSpatialReference = {wkid:4326}; //4326 //102100 //3857
query.returnGeometry = true;
query.outFields = ["*"];
on(dom.byId("executeCountySquad"), "click", executeCountySquad);
function executeCountySquad () {
query.where = "County_Nam = '"+ (dom.byId("CountyName").value) +"' AND Squad = '"+ (dom.byId("Squad").value) +"' ";
queryTask.execute(query, showResultsCountySquad);
}
function showResultsCountySquad (results) {
var resultItems = [];
var resultCount = results.features.length;
alert(resultCount)
for (var i = 0; i < resultCount; i++) {
var featureAttributes = results.features[i].attributes;
for (var attr in featureAttributes) {
resultItems.push("<b>" + attr + ":</b> " + featureAttributes[attr] + "<br>");
}
resultItems.push("<br>");
}
dom.byId("inforesults").innerHTML = resultItems.join("");
}
//======================================================
<input id="executeCountySquad" type="button" value="Get Details County Squad">
<div id="inforesultsCountySquad" style="padding:5px; font-size:8px; height:Auto; margin:5px; background-color:#eee;">Results:</div>
Solved! Go to Solution.
- Mark as New
- Bookmark
- Subscribe
- Mute
- Subscribe to RSS Feed
- Permalink
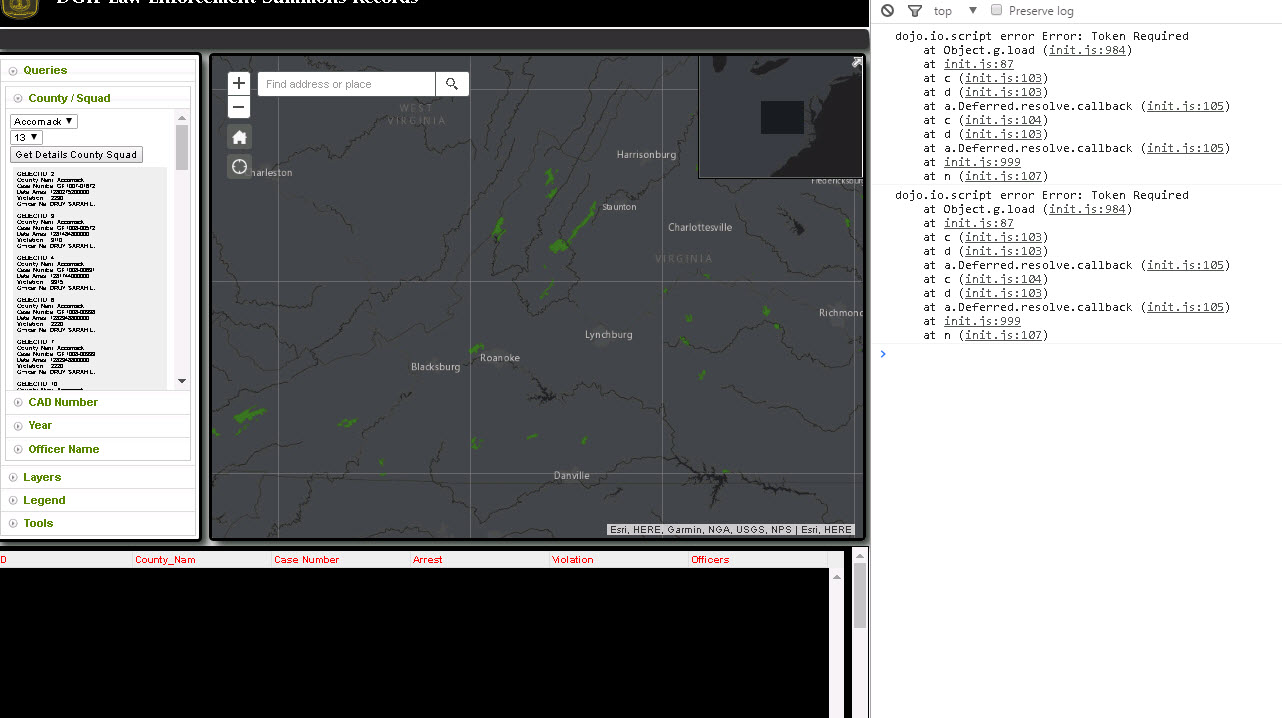
Nothing....you can see on the left in the little div there are results being displayed and in the grid at bottom nothing. NO errors int he console.
Think I might strip this app down and start again? I am clueless at this point...I have not idea why its not showing up..
- Mark as New
- Bookmark
- Subscribe
- Mute
- Subscribe to RSS Feed
- Permalink
Jay,
If you strip it down then you can share the whole code and I might be able to help more.
- Mark as New
- Bookmark
- Subscribe
- Mute
- Subscribe to RSS Feed
- Permalink
Give this a look see if you will ...click the "Get Details County Squad " button
- Mark as New
- Bookmark
- Subscribe
- Mute
- Subscribe to RSS Feed
- Permalink
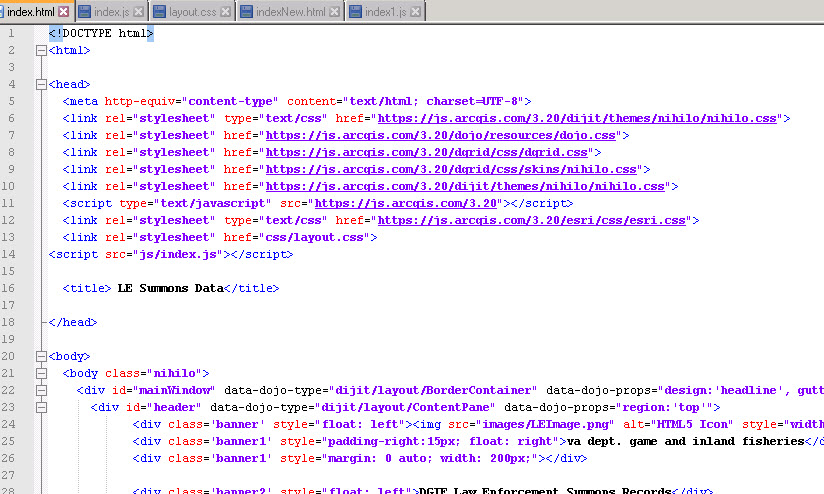
Jay,
So here is your code fixed. You main issue was you had your grid variable associated with dgrid/grid instead of dgrid/OnDemandGrid like it was suppose to be. There was also some missing css links.
<!DOCTYPE html>
<html>
<head>
<meta http-equiv="content-type" content="text/html; charset=UTF-8">
<link rel="stylesheet" type="text/css" href="https://js.arcgis.com/3.20/dijit/themes/nihilo/nihilo.css">
  <link rel="stylesheet" href="https://js.arcgis.com/3.20/dojo/resources/dojo.css">
  <link rel="stylesheet" href="https://js.arcgis.com/3.20/dgrid/css/dgrid.css">
  <link rel="stylesheet" href="https://js.arcgis.com/3.20/dgrid/css/skins/nihilo.css">
<link rel="stylesheet" href="https://js.arcgis.com/3.20/dijit/themes/nihilo/nihilo.css">
<script type="text/javascript" src="https://js.arcgis.com/3.20"></script>
<link rel="stylesheet" type="text/css" href="https://js.arcgis.com/3.20/esri/css/esri.css">
<style type="text/css">
html,
body {
height: 100%;
width: 100%;
margin: 0;
padding: 0;
}
body {
background-color: white;
overflow: hidden;
font-family: "Kimberley", sans-serif
}
#header {
-moz-border-radius: 5px;
margin: 1px;
padding-top: 10px;
padding-left: 10px;
background-color: Black;
color: white;
font-size: 18pt;
text-align: left;
font-weight: bold;
border: solid 0px black;
height: 65px;
}
.banner {
font-size: 0pt;
padding-right: 20px;
}
.banner1 {
font-size: 10pt;
}
.banner2 {
font-size: 18pt;
font-family: "Palatino Linotype", "Book Antiqua", Palatino, serif;
padding-top: 8px;
}
.bannerN {
padding-top: 2px;
padding-right: 0px;
}
#navigation {
-moz-border-radius: 5px;
margin: 1px;
padding-top: 7px;
padding-right: 8px;
background-color: #333333;
color: white;
font-size: 10pt;
text-align: right;
border: solid 0px black;
height: 20px;
}
#footer {
/*margin: 2px;*/
/*padding-right: 10px;*/
background-color: black;
color: white;
border: solid 2px black;
font-size: 10pt;
text-align: right;
height: 250px;
padding-top: 5px;
}
#rightPane {
margin: 3px;
padding: 10px;
background-color: white;
color: #421b14;
border: solid 2px #79663b;
width: 20%;
}
#leftPane {
margin: 3px;
padding: 5px;
width: 260px;
color: #3C1700;
background-color: white;
border: solid 4px black;
}
#map {
margin: 5px;
border: solid 4px black;
}
.shadow {
-o-border-radius: 6px;
-moz-border-radius: 6px;
-webkit-border-radius: 6px;
box-shadow: 8px 8px 16px #323834;
-webkit-box-shadow: 8px 8px 16px #323834;
-moz-box-shadow: 8px 8px 16px #323834;
-o-box-shadow: 8px 8px 16px #323834;
}
.nihilo .dijitAccordionText {
margin-left: 4px;
margin-right: 4px;
color: #5c8503;
}
#BasemapToggle {
position: absolute;
top: 12px;
right: 15px;
z-index: 50;
}
#HomeButton {
position: absolute;
top: 90px;
left: 20px;
z-index: 50;
}
#LocateButton {
position: absolute;
top: 130px;
left: 20px;
z-index: 50;
}
#bookmarks {
width: 245px;
z-index: 50;
background: #ffffff;
border-radius: 4px;
border: 1px solid gray;
}
#search {
position: absolute;
top: 20px;
left: 60px;
z-index: 50;
}
#info {
color: white;
font: bold 16px/16px Helvetica, Sans-Serif;
letter-spacing: -1px;
background: rgb(0, 0, 0);
background: rgba(0, 0, 0, 0.7);
}
#info2 {
color: white;
font: bold 16px/16px Helvetica, Sans-Serif;
letter-spacing: -1px;
background: #333333;
padding-top: 10px;
padding-right: 3px;
}
#LayersProps {
text-align: right;
}
#titlePane {
width: 200px;
}
#grid {
border: 0px;
width: 100%;
height: 200px;
}
#grid { height: 100%; }
.dgrid { border: none; }
.field-id { cursor: pointer; }
</style>
<title> by Jaykapalczynski</title>
<script type='text/javascript'>
require([
"esri/map", "esri/tasks/query", "esri/tasks/QueryTask", "esri/geometry/webMercatorUtils", "dojo/dom", "dojo/on", "esri/layers/FeatureLayer",
"esri/dijit/Legend", "esri/symbols/SimpleFillSymbol", "esri/renderers/SimpleRenderer", "esri/symbols/SimpleMarkerSymbol", "esri/layers/LabelClass",
"esri/dijit/BasemapToggle", "esri/dijit/HomeButton", "esri/dijit/Search", "esri/dijit/LocateButton", "esri/layers/GraphicsLayer", "esri/InfoTemplate",
"esri/Color", "dojo/_base/array", "dojo/parser", "esri/renderers/ClassBreaksRenderer", "dijit/form/CheckBox", "dojo/dom-construct",
"dojo/keys", "esri/SnappingManager", "esri/dijit/Measurement", "esri/tasks/GeometryService", "esri/config", "esri/sniff", "esri/dijit/BasemapGallery",
"esri/dijit/Bookmarks", "esri/layers/OpenStreetMapLayer", "esri/dijit/OverviewMap", "dojo/_base/declare", "dgrid/Selection",
"dgrid/OnDemandGrid", "dojo/store/Memory", "dgrid/Keyboard", "esri/layers/LabelLayer", "esri/symbols/TextSymbol", "esri/symbols/Font",
"esri/symbols/SimpleLineSymbol", "dijit/layout/BorderContainer", "dijit/layout/ContentPane", "dijit/layout/AccordionContainer","dijit/TitlePane",
"dojo/domReady!"
], function(
Map, Query, QueryTask, webMercatorUtils, dom, on, FeatureLayer,
Legend, SimpleFillSymbol, SimpleRenderer, SimpleMarkerSymbol, LabelClass,
BasemapToggle, HomeButton, Search, LocateButton, GraphicsLayer, InfoTemplate,
Color, arrayUtils, parser, ClassBreaksRenderer, CheckBox, domConstruct,
keys, SnappingManager, Measurement, GeometryService, esriConfig, has, BasemapGallery,
Bookmarks, OpenStreetMapLayer, OverviewMap, declare, Selection,
Grid, Memory, Keyboard, LabelLayer, TextSymbol, Font,
SimpleLineSymbol
) {
//VARIABLES
var legendLayers = [];
var openStreetMapLayer;
var grid;
parser.parse();
//=== GRID =========================================================================
// create the dgrid
window.grid = new(declare([Grid, Selection]))({
// use Infinity so that all data is available in the grid
bufferRows: Infinity,
columns: {
"id": "ID",
"SITENAME": "Site Name",
"COUNTY": "County",
"CLASS": "Class",
"LOCATION": "Location",
"TYPE": "Type"
}
}, "grid");
//==================================================================================
//SET THE MAP
var map = new Map("map", {
basemap: "dark-gray",
center: [-79.665, 37.629],
zoom: 8,
logo: false,
showLabels: true
});
// QUERY FOR County and Squad
var queryTask = new QueryTask("https://vafwis.dgif.virginia.gov/arcgis/rest/services/Public/BoatingAccessSites/FeatureServer/0");
var query = new Query();
query.outSpatialReference = {
wkid: 4326
}; //4326 //102100 //3857
query.returnGeometry = true;
query.outFields = ["OBJECTID", "SITENAME", "COUNTY", "CLASS", "LOCATION", "TYPE"];
var infoTemplate = new InfoTemplate();
var content = "<b>Site: </b>${SITENAME}<br/>" +
"<b>County: </b>${COUNTY}<br/>" +
"<b>Class: </b>${CLASS}<br/>" +
"<b>Location: </b>${LOCATION}<br/>" +
"<b>Type: </b>${TYPE}<br/>"
infoTemplate.setTitle("${COUNTY}");
infoTemplate.setContent(content);
//=======================================================================================================================
on(dom.byId("executeCountySquad"), "click", executeCountySquad);
function executeCountySquad() {
var test = document.getElementById("COUNTY").value
alert(test);
query.where = "COUNTY = '" + (dom.byId("COUNTY").value) + "' AND SITENAME = '" + (dom.byId("SITENAME").value) + "' ";
queryTask.execute(query, showResultsCountySquad);
}
function showResultsCountySquad(results) {
var resultItems = [];
arrayUtils.map(results.features, function(feature) {
var featureAttributes = feature.attributes;
for (var attr in featureAttributes) {
resultItems.push("<b>" + attr + ":</b> " + featureAttributes[attr] + "<br>");
}
resultItems.push("<br>");
});
dom.byId("inforesultsCountySquad").innerHTML = resultItems.join("");
var data = arrayUtils.map(results.features, function(feature) {
return {
"id": feature.attributes.OBJECTID,
"SITENAME": feature.attributes.SITENAME,
"COUNTY": feature.attributes.COUNTY,
"CLASS": feature.attributes.CLASS,
"LOCATION": feature.attributes.LOCATION,
"TYPE": feature.attributes.TYPE
};
});
var memStore = new Memory({
data: data
});
window.grid.set("store", memStore);
}
//=======================================================================================================================
queryTask.on("complete", function(event) {
alert("Query Task Complete");
var highlightSymbol = new SimpleFillSymbol(SimpleFillSymbol.STYLE_SOLID,
new SimpleLineSymbol(SimpleLineSymbol.STYLE_SOLID,
new Color([255, 0, 0]), 3), new Color([125, 125, 125, 0.35]));
var symbol = new SimpleMarkerSymbol({
"color": [255, 255, 255, 64],
"size": 12,
"angle": -30,
"xoffset": 0,
"yoffset": 0,
"type": "esriSMS",
"style": "esriSMSCircle",
"outline": {
"color": [0, 0, 0, 255],
"width": 1,
"type": "esriSLS",
"style": "esriSLSSolid"
}
});
var features = event.featureSet.features;
var countiesGraphicsLayer = new GraphicsLayer();
var featureCount = features.length;
alert(featureCount);
map.graphics.clear();
for (var i = 0; i < featureCount; i++) {
var graphic = features[i]; //Feature is a graphic
graphic.setSymbol(symbol);
graphic.setInfoTemplate(infoTemplate);
map.graphics.add(graphic);
}
});
});
</script>
</head>
<body>
<body class="nihilo">
<div id="mainWindow" data-dojo-type="dijit/layout/BorderContainer" data-dojo-props="design:'headline', gutters:false" style="width:100%; height:100%;">
<div id="header" data-dojo-type="dijit/layout/ContentPane" data-dojo-props="region:'top'">
</div>
<div id="navigation" class="shadow" data-dojo-type="dijit.layout.ContentPane" data-dojo-props="region:'top'">
</div>
<div data-dojo-type="dijit/layout/ContentPane" data-dojo-props="region:'left'" class="shadow" id="leftPane">
<div data-dojo-type="dijit/layout/AccordionContainer" style="color:black;">
<!-- 1st PANEL -->
<div data-dojo-type="dijit/layout/ContentPane" data-dojo-props="title:'Queries'" style="color:red;">
<div data-dojo-type="dijit/layout/AccordionContainer" style="color:black;">
<div data-dojo-type="dijit/layout/ContentPane" data-dojo-props="title:'County / Squad'">
<div>
<input type="text" id="COUNTY" value="Northumberland">
<br>
<input type="text" id="SITENAME" value="Shell">
<br>
<input id="executeCountySquad" type="button" value="Get Details County Squad">
<br>
<div id="inforesultsCountySquad" style="padding:5px; font-size:8px; height:Auto; margin:5px; background-color:#eee;">Results:</div>
<br>
</div>
</div>
</div>
</div>
<!-- 2nd PANEL -->
<div data-dojo-type="dijit/layout/ContentPane" data-dojo-props="title:'Layers'">
</div>
<!-- 3rd PANEL -->
<div data-dojo-type="dijit/layout/ContentPane" data-dojo-props="title:'Legend'" style="color:black;">
</div>
<!-- 4th PANEL -->
<div data-dojo-type="dijit/layout/ContentPane" data-dojo-props="title:'Tools'" style="padding:10px 0; color:Black; text-align: center;">
</div>
</div>
</div>
<div>
<div id="map" class="shadow" data-dojo-type="dijit/layout/ContentPane" data-dojo-props="region:'center'">
</div>
</div>
<div id="footer" data-dojo-type="dijit/layout/ContentPane" data-dojo-props="region:'bottom'">
<div id="grid" style="height:100%; color:red;"></div>
</div>
</div>
</body>
</html>
- Mark as New
- Bookmark
- Subscribe
- Mute
- Subscribe to RSS Feed
- Permalink
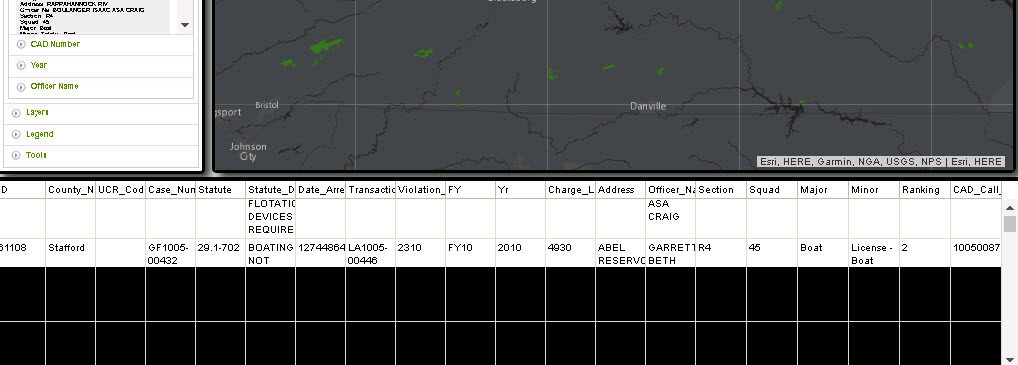
Freaking awesome man....I cannot thank you enough...on to the next task...never ending...
If you are going to the San Diego Conference this year let me buy you a couple cold ones.
Last Question: When I get a return and start scrolling through the grid all the rows are Black...if I click on it it appears...is this from not loading all the rows in the entire array? Any ideas or thoughts?
- Mark as New
- Bookmark
- Subscribe
- Mute
- Subscribe to RSS Feed
- Permalink
Jay,
Is the css links that I mentioned you were missing.
<link rel="stylesheet" href="https://js.arcgis.com/3.20/dojo/resources/dojo.css">
<link rel="stylesheet" href="https://js.arcgis.com/3.20/dgrid/css/dgrid.css">
<link rel="stylesheet" href="https://js.arcgis.com/3.20/dgrid/css/skins/nihilo.css">I haven't gone to the UC in almost 10 years now. I find the Dev Summit each year is more beneficial.
- Mark as New
- Bookmark
- Subscribe
- Mute
- Subscribe to RSS Feed
- Permalink
I have those added....is there something else I need to do? It appears that only the records that appear in the original defined space of the grid are view-able....as I scroll everything else is black with no text. But if I hover I can see data.
Yea I hit the Dev conference in DC as my company wont pay for the Palm Springs visit...
- Mark as New
- Bookmark
- Subscribe
- Mute
- Subscribe to RSS Feed
- Permalink
Jay,
Remove the background color in the footer:
#footer {
/*margin: 2px;*/
/*padding-right: 10px;*/
/*background-color: black;*/
color: white;
border: solid 2px black;
font-size: 10pt;
text-align: right;
height: 250px;
padding-top: 5px;
}
- Mark as New
- Bookmark
- Subscribe
- Mute
- Subscribe to RSS Feed
- Permalink
SON OF A B%^$#....lmao...man I cant thank you enough....
I know this is stringing and asking more than I should but do you have any idea how to link the map and table? If I click a record it highlights the feature in the map and visa versa
- Mark as New
- Bookmark
- Subscribe
- Mute
- Subscribe to RSS Feed
- Permalink
The sample did that. You just need to add in the missing portions to yours