- Home
- :
- All Communities
- :
- Developers
- :
- JavaScript Maps SDK
- :
- JavaScript Maps SDK Questions
- :
- Re: Apply edits
- Subscribe to RSS Feed
- Mark Topic as New
- Mark Topic as Read
- Float this Topic for Current User
- Bookmark
- Subscribe
- Mute
- Printer Friendly Page
- Mark as New
- Bookmark
- Subscribe
- Mute
- Subscribe to RSS Feed
- Permalink
hi,
can anyone give an example on how to apply edits while editing two layers in arcgis javasscript
Solved! Go to Solution.
- Mark as New
- Bookmark
- Subscribe
- Mute
- Subscribe to RSS Feed
- Permalink
Bharath,
What code have you tried? What errors do you get in your browsers web console? Your replies are so vague that it is hard to provide help.
- Mark as New
- Bookmark
- Subscribe
- Mute
- Subscribe to RSS Feed
- Permalink
Here is my code im adding on click both point and line,i am able to add them but unable to apply edits to them
<!DOCTYPE html>
<html>
<head>
<meta http-equiv="Content-Type" content="text/html; charset=utf-8">
<meta http-equiv="X-UA-Compatible" content="IE=7, IE=9, IE=10">
<!--The viewport meta tag is used to improve the presentation and behavior of the samples
on iOS devices-->
<meta name="viewport" content="initial-scale=1, maximum-scale=1,user-scalable=no">
<title>LT ext</title>
<link rel="stylesheet" href="http://serverapi.arcgisonline.com/jsapi/arcgis/3.5/js/dojo/dijit/themes/claro/claro.css">
<link rel="stylesheet" href="http://serverapi.arcgisonline.com/jsapi/arcgis/3.5/js/esri/css/esri.css">
<style>
html, body
{
height: 100%;
width: 100%;
margin: 0;
padding: 0;
overflow: hidden;
}
.btn
{
background: #3f3f3f;
color: #fff;
font-family: Tahoma;
font-size: 11px;
height: 18px;
}
.lbl
{
color: #000;
font-family: Tahoma;
font-size: 11px;
font-weight: 200;
}
#header
{
border: solid 1px #e4e4e4;
background: #fff;
color: #749749;
-moz-border-radius: 4em;
border-radius: 4em;
font-size: 14px;
padding-left: 20px;
font-weight: 700;
}
#map
{
padding: 1px;
border: solid 1px #e4e4e4;
-moz-border-radius: 4px;
border-radius: 4px;
}
#rightPane
{
border: none;
width: 250px;
height: 95%;
padding-bottom: 10px;
top: 20px;
border: solid 1px #e4e4e4;
}
.templatePicker
{
border: solid 2px #e4e4e4 !important;
}
</style>
<script> var dojoConfig = { parseOnLoad: true };</script>
<script src="http://serverapi.arcgisonline.com/jsapi/arcgis/3.5/"></script>
<script>
dojo.require("dijit.layout.BorderContainer");
dojo.require("dijit.layout.ContentPane");
dojo.require("esri.map");
dojo.require("esri.dijit.editing.TemplatePicker-all");
dojo.require("esri.tasks.query");
dojo.require("esri.toolbars.draw");
var map, line, lineGraphic, toolbar, symbol, geomTask;
var landuseLineLayer;
var landusePointLayer;
function init() {
//This sample requires a proxy page to handle communications with the ArcGIS Server services. You will need to
//replace the url below with the location of a proxy on your machine. See the 'Using the proxy page' help topic
//for details on setting up a proxy page.
esri.config.defaults.io.proxyUrl = "/proxy";
esri.config.defaults.io.alwaysUseProxy = false;
//This service is for development and testing purposes only. We recommend that you create your own geometry service for use within your applications.
esri.config.defaults.geometryService = new esri.tasks.GeometryService("http://tasks.arcgisonline.com/ArcGIS/rest/services/Geometry/GeometryServer");
map = new esri.Map("map", {
center: [-83.244, 42.581],
zoom: 15
});
dojo.connect(map, "onLayersAddResult", initEditing);
queryTask = new esri.tasks.QueryTask("http://localhost:6080/arcgis/rest/services/edit/MapServer/20");
// //initialize query
query = new esri.tasks.Query();
query.returnGeometry = true;
query.outFields = ["LTP_ID", "OBJECTID"];
// //create symbol for selected features
symbol = new esri.symbol.SimpleMarkerSymbol();
symbol.setStyle(esri.symbol.SimpleMarkerSymbol.STYLE_SQUARE);
symbol.setSize(10);
//symbol.setColor(new esri.Color([255, 255, 0, 0.5]));
var labels = new esri.layers.ArcGISDynamicMapServiceLayer("http://localhost:6080/arcgis/rest/services/edit/MapServer");
map.addLayer(labels);
landusePointLayer = new esri.layers.FeatureLayer("http://localhost:6080/arcgis/rest/services/edit/FeatureServer/20", {
mode: esri.layers.FeatureLayer.MODE_SNAPSHOT,
outFields: ["*"]
});
landuseLineLayer = new esri.layers.FeatureLayer("http://localhost:6080/arcgis/rest/services/edit/FeatureServer/34", {
mode: esri.layers.FeatureLayer.MODE_SNAPSHOT,
outFields: ["*"]
});
map.addLayers([landusePointLayer, landuseLineLayer]);
var ltline = landuseLineLayer;
var ltpole = landuseLineLayer;
dojo.connect(map, "onLoad", function () {
dojo.connect(dijit.byId("map"), "resize", map, map.resize);
});
}
var selectedTemplate;
function LTEXT() {
//var l = landuseLineLayer;
var p1 = new esri.geometry.Point(218103.84229999967, 1172648.3827999998, map.spatialReference);
line = new esri.geometry.Polyline();
line.addPath([p1]);
dojo.connect(map, "onClick", addPt);
}
function addPt(e) {
debugger;
var selectedTemplate;
var featureLayers;
var geometryType;
debugger;
// create a new path using the current line endpoint and the click point
//var p2 = esri.geometry.geographicToWebMercator(new esri.geometry.Point(e.mapPoint.x, e.mapPoint.y, map.spatialReference));
//line.addPath([p2]);
var pathCount = line.paths.length;
line.addPath([line.paths[pathCount - 1][line.paths[pathCount - 1].length - 1], [e.mapPoint.x, e.mapPoint.y]]);
lineGraphic = map.graphics.add(new esri.Graphic(line, new esri.symbol.SimpleLineSymbol()));
map.graphics.add(new esri.Graphic(e.mapPoint, new esri.symbol.SimpleMarkerSymbol()));
var k = landuseLineLayer;
var p = landusePointLayer;
saveedits(lineGraphic, landuseLineLayer, landusePointLayer)
//lineGraphic.setGeometry(line);
/////////////////////////////////////////////////////////////////////////////////////////////
}
function saveedits(linegraphic, landuseLineLayer, landusePointLayer) {
debugger;
var graphic;
//graphic.setAttributes(attrs);
var newGraphic = new esri.Graphic(lineGraphic, null);
landuseLineLayer.applyEdits([newGraphic], null, null);
// var newGraphic1 = new esri.Graphic1(e.mapPoint, null,null);
// landusePointLayer.applyEdits([newGraphic1], null,null);
}
function initEditing(results) {
debugger;
var map = this;
var currentLayer = null;
var layers = dojo.map(results, function (result) {
return result.layer;
});
var editToolbar = new esri.toolbars.Edit(map);
dojo.connect(editToolbar, "onDeactivate", function (tool, graphic) {
currentLayer.applyEdits(null, [graphic], null);
});
featureLayers: layers,
dojo.connect(drawToolbar, "onDrawEnd", function (geometry) {
debugger;
drawToolbar.deactivate();
editToolbar.deactivate();
var newAttributes = dojo.mixin({}, selectedTemplate.template.prototype.attributes);
var newGraphic = new esri.Graphic(geometry, null, newAttributes);
selectedTemplate.featureLayer.applyEdits([newGraphic], null, null);
});
}
function executeQueryTask(sTownID) {
debugger;
query.where = "LTP_ID ='" + sTownID + "'";
//execute query
queryTask.execute(query, showResults);
}
function showResults(featureSet) {
debugger;
//remove all graphics on the maps graphics layer
map.graphics.clear();
//Performance enhancer - assign featureSet array to a single variable.
var resultFeatures = featureSet.features;
console.log(resultFeatures);
//Loop through each feature returned
for (var i = 0, il = resultFeatures.length; i < il; i++) {
//Get the current feature from the featureSet.
//Feature is a graphic
var graphic = resultFeatures;
graphic.setSymbol(symbol);
//Set the infoTemplate.
//graphic.setInfoTemplate(infoTemplate);
//Add graphic to the map graphics layer.
map.graphics.add(graphic);
if (graphic.geometry.type === 'point') {
debugger;
map.centerAndZoom(graphic.geometry, 0.001);
}
}
}
dojo.ready(init);
</script>
</head>
<body class="claro">
<div style="height: 30px; border: solid 1px; border-color: #e4e4e4; width: 100%;
background: #f0ebff">
Header
</div>
<div style="height: 25px; border: solid 1px; border-color: #e4e4e4; width: 100%;
background: #d2d2d2; text-align: center">
ToolBar
</div>
<div data-dojo-type="dijit.layout.BorderContainer" data-dojo-props="gutters:true, design:'sidebar'"
style="width: 100%; height: 100%;">
<div id="map" data-dojo-type="dijit.layout.ContentPane" data-dojo-props="region:'center'">
</div>
<div id="rightPane" data-dojo-type="dijit.layout.ContentPane" data-dojo-props="region:'right'">
<span class="lbl">Enter Value :</span>
<input type="text" id="pop" style="width: 150px;" />
<input type="button" value="Zoom" onclick="executeQueryTask(dojo.byId('pop').value);"
class="btn" />
<div id="templatePickerDiv1">
<input type="button" id="templatePickerDiv" value="Start LT Ext" onclick="LTEXT()"
class="btn" />
</div>
</div>
</div>
</body>
</html>
- Mark as New
- Bookmark
- Subscribe
- Mute
- Subscribe to RSS Feed
- Permalink
Bharath,
Are you running your .html file from a localhost or from a file?The edits are usually not saved if they are just run from a file.What codes have you tried so far? Do you want only attribute editing or full editing (attributes + geometry)?
- Mark as New
- Bookmark
- Subscribe
- Mute
- Subscribe to RSS Feed
- Permalink
I am trying full editng here is my code.i am able to add point and line on click but unable to save them
<!DOCTYPE html>
<html>
<head>
<meta http-equiv="Content-Type" content="text/html; charset=utf-8">
<meta http-equiv="X-UA-Compatible" content="IE=7, IE=9, IE=10">
<!--The viewport meta tag is used to improve the presentation and behavior of the samples
on iOS devices-->
<meta name="viewport" content="initial-scale=1, maximum-scale=1,user-scalable=no">
<title>LT ext</title>
<link rel="stylesheet" href="http://serverapi.arcgisonline.com/jsapi/arcgis/3.5/js/dojo/dijit/themes/claro/claro.css">
<link rel="stylesheet" href="http://serverapi.arcgisonline.com/jsapi/arcgis/3.5/js/esri/css/esri.css">
<style>
html, body
{
height: 100%;
width: 100%;
margin: 0;
padding: 0;
overflow: hidden;
}
.btn
{
background: #3f3f3f;
color: #fff;
font-family: Tahoma;
font-size: 11px;
height: 18px;
}
.lbl
{
color: #000;
font-family: Tahoma;
font-size: 11px;
font-weight: 200;
}
#header
{
border: solid 1px #e4e4e4;
background: #fff;
color: #749749;
-moz-border-radius: 4em;
border-radius: 4em;
font-size: 14px;
padding-left: 20px;
font-weight: 700;
}
#map
{
padding: 1px;
border: solid 1px #e4e4e4;
-moz-border-radius: 4px;
border-radius: 4px;
}
#rightPane
{
border: none;
width: 250px;
height: 95%;
padding-bottom: 10px;
top: 20px;
border: solid 1px #e4e4e4;
}
.templatePicker
{
border: solid 2px #e4e4e4 !important;
}
</style>
<script> var dojoConfig = { parseOnLoad: true };</script>
<script src="http://serverapi.arcgisonline.com/jsapi/arcgis/3.5/"></script>
<script>
dojo.require("dijit.layout.BorderContainer");
dojo.require("dijit.layout.ContentPane");
dojo.require("esri.map");
dojo.require("esri.dijit.editing.TemplatePicker-all");
dojo.require("esri.tasks.query");
dojo.require("esri.toolbars.draw");
var map, line, lineGraphic, toolbar, symbol, geomTask;
var landuseLineLayer;
var landusePointLayer;
function init() {
//This sample requires a proxy page to handle communications with the ArcGIS Server services. You will need to
//replace the url below with the location of a proxy on your machine. See the 'Using the proxy page' help topic
//for details on setting up a proxy page.
esri.config.defaults.io.proxyUrl = "/proxy";
esri.config.defaults.io.alwaysUseProxy = false;
//This service is for development and testing purposes only. We recommend that you create your own geometry service for use within your applications.
esri.config.defaults.geometryService = new esri.tasks.GeometryService("http://tasks.arcgisonline.com/ArcGIS/rest/services/Geometry/GeometryServer");
map = new esri.Map("map", {
center: [-83.244, 42.581],
zoom: 15
});
dojo.connect(map, "onLayersAddResult", initEditing);
queryTask = new esri.tasks.QueryTask("http://localhost:6080/arcgis/rest/services/edit/MapServer/20");
// //initialize query
query = new esri.tasks.Query();
query.returnGeometry = true;
query.outFields = ["LTP_ID", "OBJECTID"];
// //create symbol for selected features
symbol = new esri.symbol.SimpleMarkerSymbol();
symbol.setStyle(esri.symbol.SimpleMarkerSymbol.STYLE_SQUARE);
symbol.setSize(10);
//symbol.setColor(new esri.Color([255, 255, 0, 0.5]));
var labels = new esri.layers.ArcGISDynamicMapServiceLayer("http://localhost:6080/arcgis/rest/services/edit/MapServer");
map.addLayer(labels);
landusePointLayer = new esri.layers.FeatureLayer("http://localhost:6080/arcgis/rest/services/edit/FeatureServer/20", {
mode: esri.layers.FeatureLayer.MODE_SNAPSHOT,
outFields: ["*"]
});
landuseLineLayer = new esri.layers.FeatureLayer("http://localhost:6080/arcgis/rest/services/edit/FeatureServer/34", {
mode: esri.layers.FeatureLayer.MODE_SNAPSHOT,
outFields: ["*"]
});
map.addLayers([landusePointLayer, landuseLineLayer]);
var ltline = landuseLineLayer;
var ltpole = landuseLineLayer;
dojo.connect(map, "onLoad", function () {
dojo.connect(dijit.byId("map"), "resize", map, map.resize);
});
}
var selectedTemplate;
function LTEXT() {
//var l = landuseLineLayer;
var p1 = new esri.geometry.Point(218103.84229999967, 1172648.3827999998, map.spatialReference);
line = new esri.geometry.Polyline();
line.addPath([p1]);
dojo.connect(map, "onClick", addPt);
}
function addPt(e) {
debugger;
var selectedTemplate;
var featureLayers;
var geometryType;
debugger;
// create a new path using the current line endpoint and the click point
//var p2 = esri.geometry.geographicToWebMercator(new esri.geometry.Point(e.mapPoint.x, e.mapPoint.y, map.spatialReference));
//line.addPath([p2]);
var pathCount = line.paths.length;
line.addPath([line.paths[pathCount - 1][line.paths[pathCount - 1].length - 1], [e.mapPoint.x, e.mapPoint.y]]);
lineGraphic = map.graphics.add(new esri.Graphic(line, new esri.symbol.SimpleLineSymbol()));
map.graphics.add(new esri.Graphic(e.mapPoint, new esri.symbol.SimpleMarkerSymbol()));
var k = landuseLineLayer;
var p = landusePointLayer;
saveedits(lineGraphic, landuseLineLayer, landusePointLayer)
//lineGraphic.setGeometry(line);
/////////////////////////////////////////////////////////////////////////////////////////////
}
function saveedits(linegraphic, landuseLineLayer, landusePointLayer) {
debugger;
var graphic;
//graphic.setAttributes(attrs);
var newGraphic = new esri.Graphic(lineGraphic, null);
landuseLineLayer.applyEdits([newGraphic], null, null);
// var newGraphic1 = new esri.Graphic1(e.mapPoint, null,null);
// landusePointLayer.applyEdits([newGraphic1], null,null);
}
function initEditing(results) {
debugger;
var map = this;
var currentLayer = null;
var layers = dojo.map(results, function (result) {
return result.layer;
});
var editToolbar = new esri.toolbars.Edit(map);
dojo.connect(editToolbar, "onDeactivate", function (tool, graphic) {
currentLayer.applyEdits(null, [graphic], null);
});
featureLayers: layers,
dojo.connect(drawToolbar, "onDrawEnd", function (geometry) {
debugger;
drawToolbar.deactivate();
editToolbar.deactivate();
var newAttributes = dojo.mixin({}, selectedTemplate.template.prototype.attributes);
var newGraphic = new esri.Graphic(geometry, null, newAttributes);
selectedTemplate.featureLayer.applyEdits([newGraphic], null, null);
});
}
function executeQueryTask(sTownID) {
debugger;
query.where = "LTP_ID ='" + sTownID + "'";
//execute query
queryTask.execute(query, showResults);
}
function showResults(featureSet) {
debugger;
//remove all graphics on the maps graphics layer
map.graphics.clear();
//Performance enhancer - assign featureSet array to a single variable.
var resultFeatures = featureSet.features;
console.log(resultFeatures);
//Loop through each feature returned
for (var i = 0, il = resultFeatures.length; i < il; i++) {
//Get the current feature from the featureSet.
//Feature is a graphic
var graphic = resultFeatures;
graphic.setSymbol(symbol);
//Set the infoTemplate.
//graphic.setInfoTemplate(infoTemplate);
//Add graphic to the map graphics layer.
map.graphics.add(graphic);
if (graphic.geometry.type === 'point') {
debugger;
map.centerAndZoom(graphic.geometry, 0.001);
}
}
}
dojo.ready(init);
</script>
</head>
<body class="claro">
<div style="height: 30px; border: solid 1px; border-color: #e4e4e4; width: 100%;
background: #f0ebff">
Header
</div>
<div style="height: 25px; border: solid 1px; border-color: #e4e4e4; width: 100%;
background: #d2d2d2; text-align: center">
ToolBar
</div>
<div data-dojo-type="dijit.layout.BorderContainer" data-dojo-props="gutters:true, design:'sidebar'"
style="width: 100%; height: 100%;">
<div id="map" data-dojo-type="dijit.layout.ContentPane" data-dojo-props="region:'center'">
</div>
<div id="rightPane" data-dojo-type="dijit.layout.ContentPane" data-dojo-props="region:'right'">
<span class="lbl">Enter Value :</span>
<input type="text" id="pop" style="width: 150px;" />
<input type="button" value="Zoom" onclick="executeQueryTask(dojo.byId('pop').value);"
class="btn" />
<div id="templatePickerDiv1">
<input type="button" id="templatePickerDiv" value="Start LT Ext" onclick="LTEXT()"
class="btn" />
</div>
</div>
</div>
</body>
</html>
- Mark as New
- Bookmark
- Subscribe
- Mute
- Subscribe to RSS Feed
- Permalink
while applying edits i am getting following error TypeError: Cannot read property '_getInfo' of undefined
- Mark as New
- Bookmark
- Subscribe
- Mute
- Subscribe to RSS Feed
- Permalink
Bharath,
In your code you use: selectedTemplate.template.prototype.attributes but I never see where you define what selectedTemplate is.
- Mark as New
- Bookmark
- Subscribe
- Mute
- Subscribe to RSS Feed
- Permalink
Robert,
Selected template is their in the code which i have posted but im not using that part im tring to apply edits for line feature here is the modified code
<!DOCTYPE html>
<html>
<head>
<meta http-equiv="Content-Type" content="text/html; charset=utf-8">
<meta http-equiv="X-UA-Compatible" content="IE=7, IE=9, IE=10">
<!--The viewport meta tag is used to improve the presentation and behavior of the samples
on iOS devices-->
<meta name="viewport" content="initial-scale=1, maximum-scale=1,user-scalable=no">
<title>LT ext</title>
<link rel="stylesheet" href="http://serverapi.arcgisonline.com/jsapi/arcgis/3.5/js/dojo/dijit/themes/claro/claro.css">
<link rel="stylesheet" href="http://serverapi.arcgisonline.com/jsapi/arcgis/3.5/js/esri/css/esri.css">
<style>
html, body
{
height: 100%;
width: 100%;
margin: 0;
padding: 0;
overflow: hidden;
}
.btn
{
background: #3f3f3f;
color: #fff;
font-family: Tahoma;
font-size: 11px;
height: 18px;
}
.lbl
{
color: #000;
font-family: Tahoma;
font-size: 11px;
font-weight: 200;
}
#header
{
border: solid 1px #e4e4e4;
background: #fff;
color: #749749;
-moz-border-radius: 4em;
border-radius: 4em;
font-size: 14px;
padding-left: 20px;
font-weight: 700;
}
#map
{
padding: 1px;
border: solid 1px #e4e4e4;
-moz-border-radius: 4px;
border-radius: 4px;
}
#rightPane
{
border: none;
width: 250px;
height: 95%;
padding-bottom: 10px;
top: 20px;
border: solid 1px #e4e4e4;
}
.templatePicker
{
border: solid 2px #e4e4e4 !important;
}
</style>
<script> var dojoConfig = { parseOnLoad: true };</script>
<script src="http://serverapi.arcgisonline.com/jsapi/arcgis/3.5/"></script>
<script>
dojo.require("dijit.layout.BorderContainer");
dojo.require("dijit.layout.ContentPane");
dojo.require("esri.map");
dojo.require("esri.dijit.editing.TemplatePicker-all");
dojo.require("esri.tasks.query");
dojo.require("esri.toolbars.draw");
var map, line, lineGraphic, toolbar, symbol, geomTask;
var landuseLineLayer;
var landusePointLayer;
function init() {
//This sample requires a proxy page to handle communications with the ArcGIS Server services. You will need to
//replace the url below with the location of a proxy on your machine. See the 'Using the proxy page' help topic
//for details on setting up a proxy page.
esri.config.defaults.io.proxyUrl = "/proxy";
esri.config.defaults.io.alwaysUseProxy = false;
//This service is for development and testing purposes only. We recommend that you create your own geometry service for use within your applications.
esri.config.defaults.geometryService = new esri.tasks.GeometryService("http://tasks.arcgisonline.com/ArcGIS/rest/services/Geometry/GeometryServer");
map = new esri.Map("map", {
center: [-83.244, 42.581],
zoom: 15
});
dojo.connect(map, "onLayersAddResult", initEditing);
queryTask = new esri.tasks.QueryTask("http://localhost:6080/arcgis/rest/services/edit/MapServer/20");
// //initialize query
query = new esri.tasks.Query();
query.returnGeometry = true;
query.outFields = ["LTP_ID", "OBJECTID"];
// //create symbol for selected features
symbol = new esri.symbol.SimpleMarkerSymbol();
symbol.setStyle(esri.symbol.SimpleMarkerSymbol.STYLE_SQUARE);
symbol.setSize(10);
//symbol.setColor(new esri.Color([255, 255, 0, 0.5]));
var labels = new esri.layers.ArcGISDynamicMapServiceLayer("http://localhost:6080/arcgis/rest/services/edit/MapServer");
map.addLayer(labels);
landusePointLayer = new esri.layers.FeatureLayer("http://localhost:6080/arcgis/rest/services/edit/FeatureServer/20", {
mode: esri.layers.FeatureLayer.MODE_SNAPSHOT,
outFields: ["*"]
});
landuseLineLayer = new esri.layers.FeatureLayer("http://localhost:6080/arcgis/rest/services/edit/FeatureServer/34", {
mode: esri.layers.FeatureLayer.MODE_SNAPSHOT,
outFields: ["*"]
});
map.addLayers([landusePointLayer, landuseLineLayer]);
var ltline = landuseLineLayer;
var ltpole = landuseLineLayer;
dojo.connect(map, "onLoad", function () {
dojo.connect(dijit.byId("map"), "resize", map, map.resize);
});
}
var selectedTemplate;
function LTEXT() {
//var l = landuseLineLayer;
var p1 = new esri.geometry.Point(218103.84229999967, 1172648.3827999998, map.spatialReference);
line = new esri.geometry.Polyline();
line.addPath([p1]);
dojo.connect(map, "onClick", addPt);
}
function addPt(e) {
debugger;
var selectedTemplate;
var featureLayers;
var geometryType;
debugger;
// create a new path using the current line endpoint and the click point
//var p2 = esri.geometry.geographicToWebMercator(new esri.geometry.Point(e.mapPoint.x, e.mapPoint.y, map.spatialReference));
//line.addPath([p2]);
var pathCount = line.paths.length;
line.addPath([line.paths[pathCount - 1][line.paths[pathCount - 1].length - 1], [e.mapPoint.x, e.mapPoint.y]]);
lineGraphic = map.graphics.add(new esri.Graphic(line, new esri.symbol.SimpleLineSymbol()));
map.graphics.add(new esri.Graphic(e.mapPoint, new esri.symbol.SimpleMarkerSymbol()));
var k = landuseLineLayer;
var p = landusePointLayer;
saveedits(lineGraphic, landuseLineLayer, landusePointLayer)
//lineGraphic.setGeometry(line);
/////////////////////////////////////////////////////////////////////////////////////////////
}
function saveedits(linegraphic, landuseLineLayer, landusePointLayer) {
debugger;
var graphic;
//graphic.setAttributes(attrs);
var newGraphic = new esri.Graphic(lineGraphic, null);
landuseLineLayer.applyEdits([newGraphic], null, null);
// var newGraphic1 = new esri.Graphic1(e.mapPoint, null,null);
// landusePointLayer.applyEdits([newGraphic1], null,null);
}
}
function executeQueryTask(sTownID) {
debugger;
query.where = "LTP_ID ='" + sTownID + "'";
//execute query
queryTask.execute(query, showResults);
}
function showResults(featureSet) {
debugger;
//remove all graphics on the maps graphics layer
map.graphics.clear();
//Performance enhancer - assign featureSet array to a single variable.
var resultFeatures = featureSet.features;
console.log(resultFeatures);
//Loop through each feature returned
for (var i = 0, il = resultFeatures.length; i < il; i++) {
//Get the current feature from the featureSet.
//Feature is a graphic
var graphic = resultFeatures;
graphic.setSymbol(symbol);
//Set the infoTemplate.
//graphic.setInfoTemplate(infoTemplate);
//Add graphic to the map graphics layer.
map.graphics.add(graphic);
if (graphic.geometry.type === 'point') {
debugger;
map.centerAndZoom(graphic.geometry, 0.001);
}
}
}
dojo.ready(init);
</script>
</head>
<body class="claro">
<div style="height: 30px; border: solid 1px; border-color: #e4e4e4; width: 100%;
background: #f0ebff">
Header
</div>
<div style="height: 25px; border: solid 1px; border-color: #e4e4e4; width: 100%;
background: #d2d2d2; text-align: center">
ToolBar
</div>
<div data-dojo-type="dijit.layout.BorderContainer" data-dojo-props="gutters:true, design:'sidebar'"
style="width: 100%; height: 100%;">
<div id="map" data-dojo-type="dijit.layout.ContentPane" data-dojo-props="region:'center'">
</div>
<div id="rightPane" data-dojo-type="dijit.layout.ContentPane" data-dojo-props="region:'right'">
<span class="lbl">Enter Value :</span>
<input type="text" id="pop" style="width: 150px;" />
<input type="button" value="Zoom" onclick="executeQueryTask(dojo.byId('pop').value);"
class="btn" />
<div id="templatePickerDiv1">
<input type="button" id="templatePickerDiv" value="Start LT Ext" onclick="LTEXT()"
class="btn" />
</div>
</div>
</div>
</body>
</body>
- Mark as New
- Bookmark
- Subscribe
- Mute
- Subscribe to RSS Feed
- Permalink
Bharath,
In your addPt function you have:
.......
lineGraphic = map.graphics.add(new esri.Graphic(line, new esri.symbol.SimpleLineSymbol()));
map.graphics.add(new esri.Graphic(e.mapPoint, new esri.symbol.SimpleMarkerSymbol()));
var k = landuseLineLayer;
var p = landusePointLayer;
saveedits(lineGraphic, landuseLineLayer, landusePointLayer)Where lineGraphic is a graphic object. Then in your saveedits function you attempt to create a new graphic out of the lineGraphic which is already a Graphic...
function saveedits(linegraphic, landuseLineLayer, landusePointLayer) {
debugger;
var graphic;
//graphic.setAttributes(attrs);
var newGraphic = new esri.Graphic(lineGraphic, null);
landuseLineLayer.applyEdits([newGraphic], null, null);
// var newGraphic1 = new esri.Graphic1(e.mapPoint, null,null);
// landusePointLayer.applyEdits([newGraphic1], null,null);
}So It should be just:
function saveedits(linegraphic, landuseLineLayer, landusePointLayer) {
debugger;
landuseLineLayer.applyEdits([linegraphic], null, null);
}- Mark as New
- Bookmark
- Subscribe
- Mute
- Subscribe to RSS Feed
- Permalink
I have tried the process which u mentioned but i am getting following error (index):15 Error: Unable to complete operation.(…)
moreover line graphics are disabling while applying edits waiting for ur reply
- Mark as New
- Bookmark
- Subscribe
- Mute
- Subscribe to RSS Feed
- Permalink
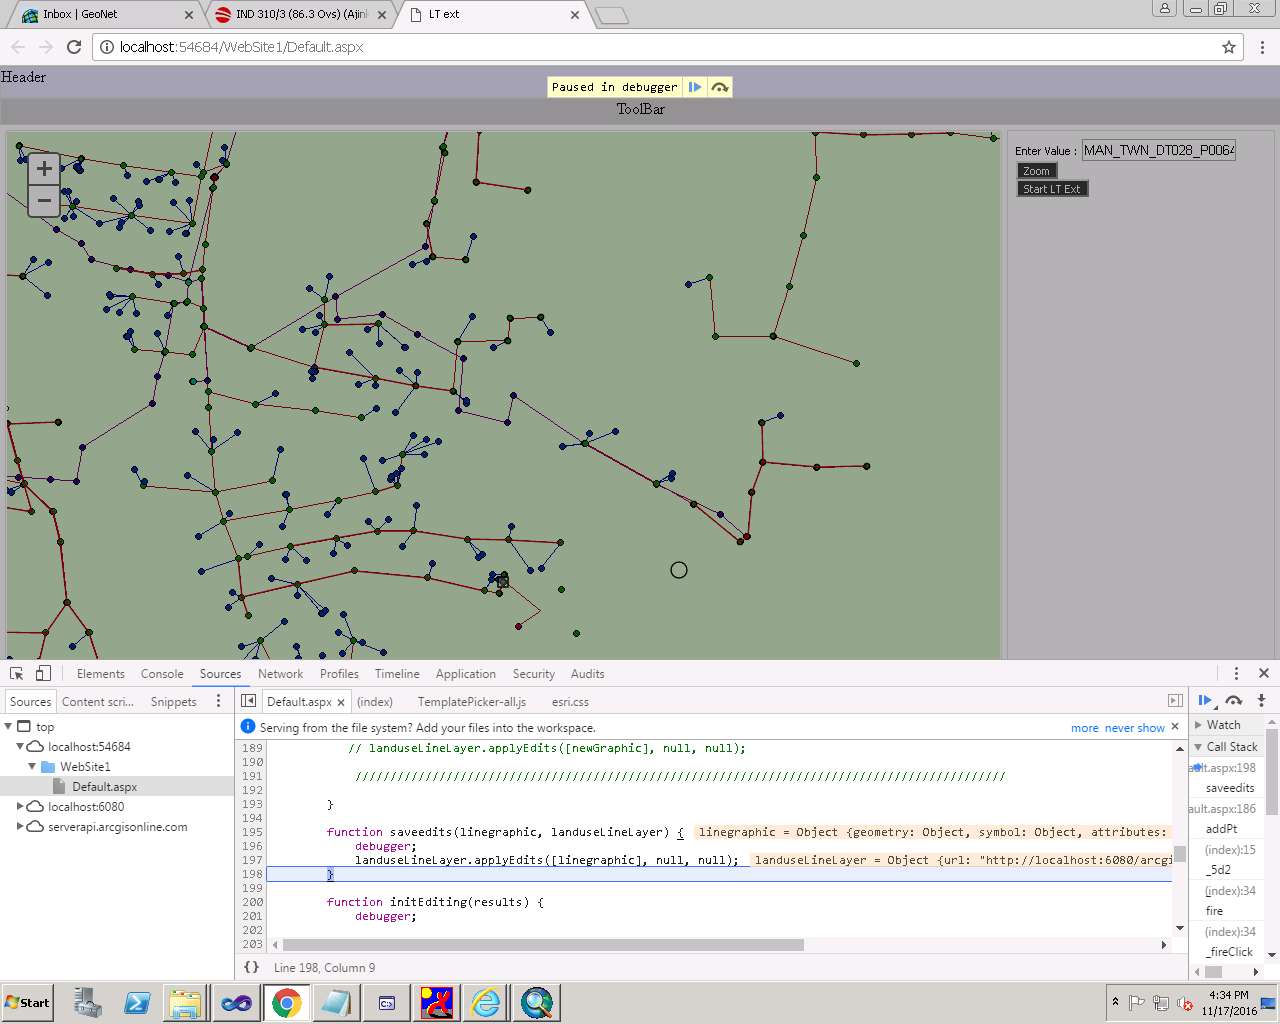
Robert,
I am attaching files of graphics which are disappearing while applying edits