- Home
- :
- All Communities
- :
- Products
- :
- ArcGIS Experience Builder
- :
- ArcGIS Experience Builder Questions
- :
- Re: Selection in chart not zooming to features in ...
- Subscribe to RSS Feed
- Mark Topic as New
- Mark Topic as Read
- Float this Topic for Current User
- Bookmark
- Subscribe
- Mute
- Printer Friendly Page
Selection in chart not zooming to features in map?
- Mark as New
- Bookmark
- Subscribe
- Mute
- Subscribe to RSS Feed
- Permalink
Hi there,
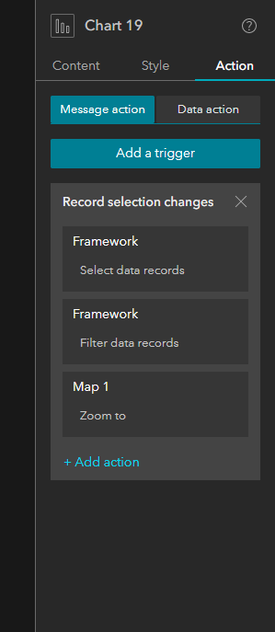
I would like my chart to filter, select and zoom to selected features in the map. At the moment it selects and filters but does not zoom to the features.
This is how my chart actions are set up
And this is the map
Any pointers would be greatly appreciated thanks 🙂
Solved! Go to Solution.
Accepted Solutions
- Mark as New
- Bookmark
- Subscribe
- Mute
- Subscribe to RSS Feed
- Permalink
I dug for a while and found that this should be a known limitation at this moment. For W-Chart & W-Map interactions, there are only Flash and Filter supported. It appears that the options of "Zoom" and "Pan" in the Chart widget were not removed from the UI so it is documented here: ExB Chart widget > interaction options note
For this function itself -
From my understanding, unlike the Query widget, which directly utilizes the added data source, Chart creates an output data source (i.e. Chart statistics) right when data gets rendered. Once that happens, it lost all geospatial reference, thus, there is no way to get the extent for zoom or pan which depends on geometry, when you select anything from the Chart widget.
- Mark as New
- Bookmark
- Subscribe
- Mute
- Subscribe to RSS Feed
- Permalink
Hi,
I am also facing similar issue. Not able to zoom to feature, where as I can able to do select, flash.
Do you have any further update/enhancement on your post. If you have any success, please share.
Thanks,
Ashok
- Mark as New
- Bookmark
- Subscribe
- Mute
- Subscribe to RSS Feed
- Permalink
Hi Ashok, I spoke to an Esri consultant and they were quite certain that it is not possible as there is no "geometric values" in the statistical chart?
- Mark as New
- Bookmark
- Subscribe
- Mute
- Subscribe to RSS Feed
- Permalink
Hi,
But we are able to select/flash the feature on Select Data Records Trigger/Action.
Then why we are not able to zoom to feature.
Can any ESRI people respond on this. Or please let us know if it can be implemented in future releases.
Because it is very common functionality that any user can look for zoom to feature on bar chart item click.
Thanks,
Ashok
- Mark as New
- Bookmark
- Subscribe
- Mute
- Subscribe to RSS Feed
- Permalink
Yes that's what I thought, can someone from Esri please touch base on this?
- Mark as New
- Bookmark
- Subscribe
- Mute
- Subscribe to RSS Feed
- Permalink
I dug for a while and found that this should be a known limitation at this moment. For W-Chart & W-Map interactions, there are only Flash and Filter supported. It appears that the options of "Zoom" and "Pan" in the Chart widget were not removed from the UI so it is documented here: ExB Chart widget > interaction options note
For this function itself -
From my understanding, unlike the Query widget, which directly utilizes the added data source, Chart creates an output data source (i.e. Chart statistics) right when data gets rendered. Once that happens, it lost all geospatial reference, thus, there is no way to get the extent for zoom or pan which depends on geometry, when you select anything from the Chart widget.
- Mark as New
- Bookmark
- Subscribe
- Mute
- Subscribe to RSS Feed
- Permalink
We will look into that and see if there will be any enhancement possibilities.
- Mark as New
- Bookmark
- Subscribe
- Mute
- Subscribe to RSS Feed
- Permalink
I too would like to have the ability to select features in a chart and have the map pan and zoom. After talking with ESRI support, I have learned that this is a known limitation and that an enhancement case has been opened: ENH-000151058 Chart: support geometry-related message actions like zoom/pan to. Experience Builder = work in progress.
- Mark as New
- Bookmark
- Subscribe
- Mute
- Subscribe to RSS Feed
- Permalink
I am hoping that @Jianxia may be able to provide the status on the ability to select a feature in an Experience Builder bar chart widget for example and then see the map pan and zoom on the selected feature.


