- Home
- :
- All Communities
- :
- Products
- :
- ArcGIS Dashboards
- :
- ArcGIS Dashboards Questions
- :
- Serial Chart: Any way to hide "Show all"
- Subscribe to RSS Feed
- Mark Topic as New
- Mark Topic as Read
- Float this Topic for Current User
- Bookmark
- Subscribe
- Mute
- Printer Friendly Page
Serial Chart: Any way to hide "Show all"
- Mark as New
- Bookmark
- Subscribe
- Mute
- Subscribe to RSS Feed
- Permalink
Heya!
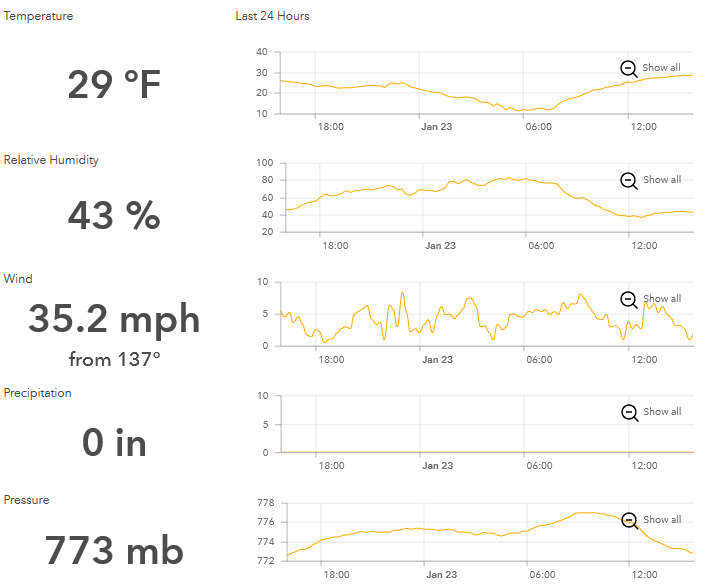
We are working on a weather dashboard that includes the current value along with a chart showing the values from the past 24 hrs (at most 96 values for a particular weather tower). The source table for the charts contains all values for all towers (5 towers total) for 48 hours -- but is then filtered at run time to show only the last 24 hours for one tower.
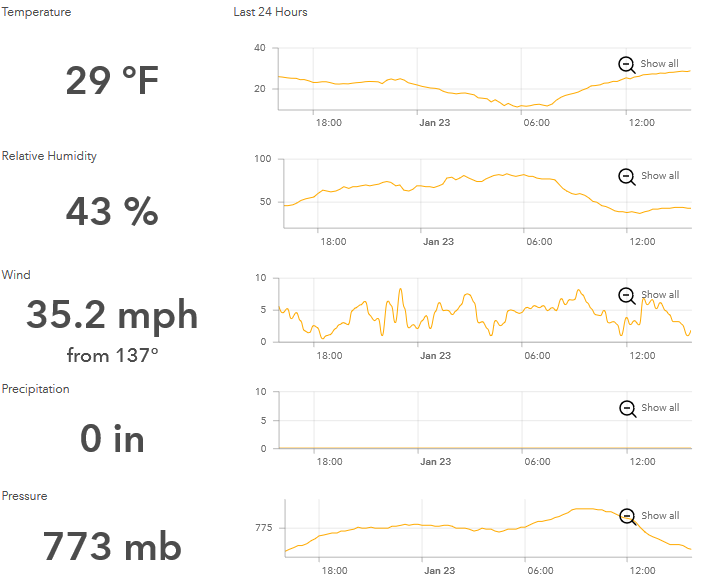
When the charts draw, they all show this "Show all" button. and when you click it, maybe more data comes in (though the overall trend of the chart doesn't change), but the lines for the values change -- and it's confusing for our users.
Is there a way to turn the "Show all" thing off or prevent it from displaying? Perhaps there's something in the way it's configured causing it to show up?
We are using Portal 10.6.1 for this one...
Charts when the dashboard first loads....
and after clicking "Show all"
- Mark as New
- Bookmark
- Subscribe
- Mute
- Subscribe to RSS Feed
- Permalink
Hi Jess,
The behavior you're describing looks like this might be a bug. Can you please contact Tech Support and open an issue so we can get detailed repro steps? Sorry.
Hope this helps,
- Mark as New
- Bookmark
- Subscribe
- Mute
- Subscribe to RSS Feed
- Permalink
Thanks, Derek!
no worries! After posting this, I was working on some different charts and had the same thought - that perhaps there was a bug. I'll submit something to tech support.
thank you!