- Home
- :
- All Communities
- :
- Products
- :
- ArcGIS Dashboards
- :
- ArcGIS Dashboards Questions
- :
- Re: operations dashboard error when viewing as ano...
- Subscribe to RSS Feed
- Mark Topic as New
- Mark Topic as Read
- Float this Topic for Current User
- Bookmark
- Subscribe
- Mute
- Printer Friendly Page
operations dashboard error when viewing as anonymous
- Mark as New
- Bookmark
- Subscribe
- Mute
- Subscribe to RSS Feed
- Permalink
Hello,
I created a simple project on the operations dashboard that shows a webmap - no widgets or nothing else but a webmap with nothing special in it.
I saved the project and shared it with everyone.
When I try to access the application as a named user it shows up well.
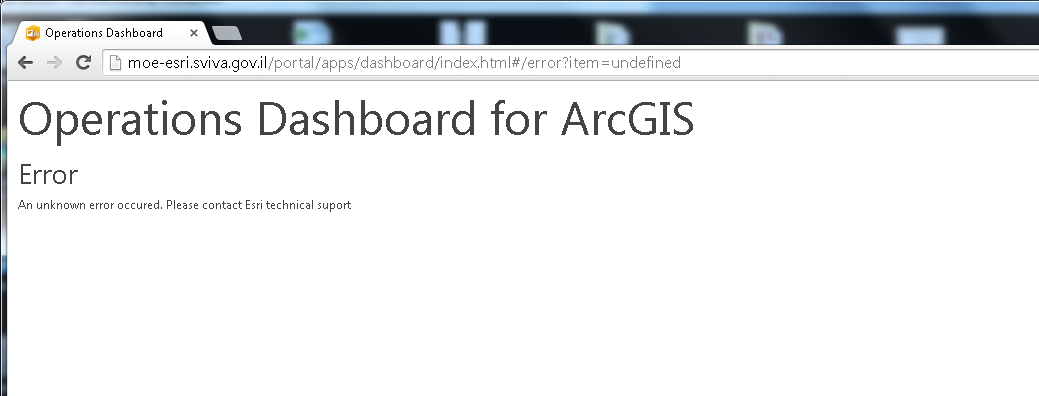
When I try to access the application as anonymous, I get an error - I have attached a screenshot.
Did anyone else experienced this before? should be very simple and easy to reproduce..
The console window throws an error referring to the js framework which fails to load the map but I couldn't find any connection with identifying the connected user (which is the reason for this error apparently)
Same behavior with Chrome and IE
Solved! Go to Solution.
- Mark as New
- Bookmark
- Subscribe
- Mute
- Subscribe to RSS Feed
- Permalink
The map and all our data is inside the organization so unfortunately not. The webmap is available anonymously, I have many other processes and map viewers that are using it.
- Mark as New
- Bookmark
- Subscribe
- Mute
- Subscribe to RSS Feed
- Permalink
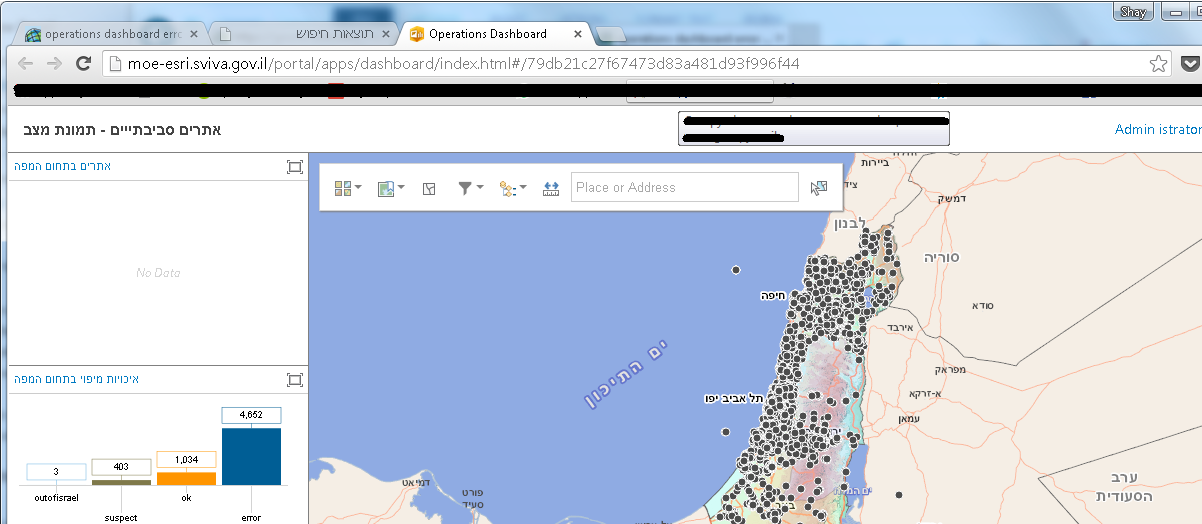
Here's another simulation.. A picture of the dashboard (in the browser) when I'm connected as a user
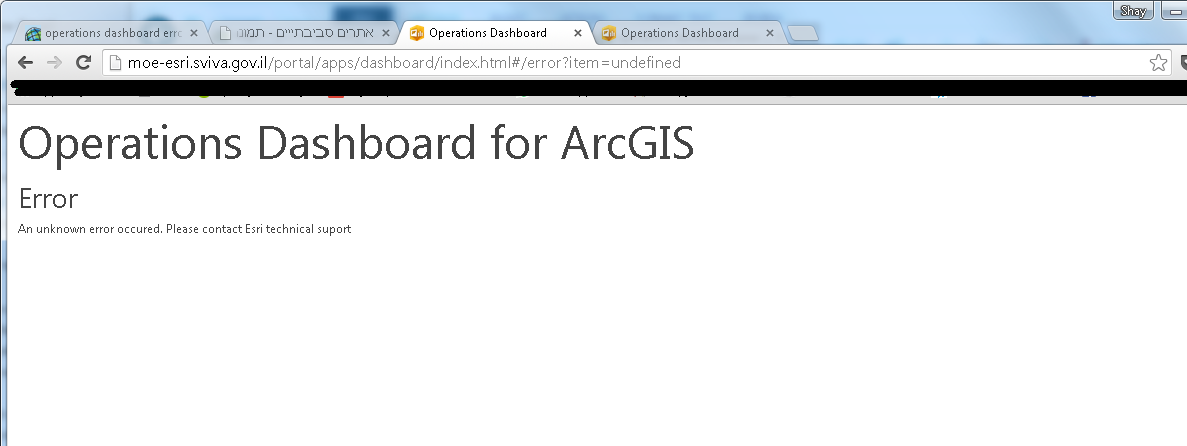
And here is the exact same app when I disconnect and surf anonymously
There is another bug with the count widget when viewing through the web and not local desktop client but that's another long story.. Also when clicking the item in the portal it keeps suggesting an installation of the dashboard instead of by default opening the browser client - which is a real pain for users experience!
- Mark as New
- Bookmark
- Subscribe
- Mute
- Subscribe to RSS Feed
- Permalink
The error message you're getting is interesting because it was something that was fixed in the July 2015 release as Tif mentioned above. ("support" is incorrectly spelled with only one 'p').
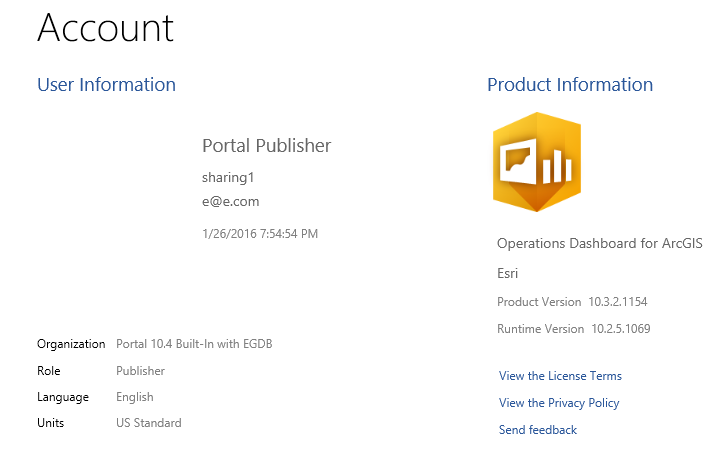
What version of dashboard is this? Can you send a screenshot of the Account screen?
I'm using the 10.4 version here:
- Mark as New
- Bookmark
- Subscribe
- Mute
- Subscribe to RSS Feed
- Permalink
Wow what a sharp eye  That is so weird. I haven't updated to 10.4 yet but it's just around my corner.
This may sound silly but I actually never thought about installing a new version of this app... It was originally installed on Sep 2015 Manually - ESRI's OneClick installation is not an option for us to use since we are a secured organization.
I'll update the version and let you know if anything changed for the good (or worse).
Thanks again!!
- Mark as New
- Bookmark
- Subscribe
- Mute
- Subscribe to RSS Feed
- Permalink
So I've just downloaded the deployment utility file to install a new version and apparently it's the same version as the existing one so nothing have changed. By the name of the file, it seems that the version is 1032_147979
The dashboard version you attached as a screenshot belongs to the client side WPF application.. the web based Dashboard is a different "app" and that's the one I'm referring to. There is no option to see a version but the filename pretty much shows it clearly. But again, I did not find any newer version  For the web version that is
- Mark as New
- Bookmark
- Subscribe
- Mute
- Subscribe to RSS Feed
- Permalink
This is something that should be fixed in the 10.4 version of Portal. It was just released a couple weeks ago so once you can upgrade to that, this issue will be resolved.
- Mark as New
- Bookmark
- Subscribe
- Mute
- Subscribe to RSS Feed
- Permalink
Thanks I'll keep an eye and update once we upgrade
- « Previous
-
- 1
- 2
- Next »
- « Previous
-
- 1
- 2
- Next »