- Home
- :
- All Communities
- :
- Products
- :
- ArcGIS Dashboards
- :
- ArcGIS Dashboards Questions
- :
- How to concatenate fields to show Graph...
- Subscribe to RSS Feed
- Mark Topic as New
- Mark Topic as Read
- Float this Topic for Current User
- Bookmark
- Subscribe
- Mute
- Printer Friendly Page
- Mark as New
- Bookmark
- Subscribe
- Mute
- Subscribe to RSS Feed
- Permalink
Hi Folks,
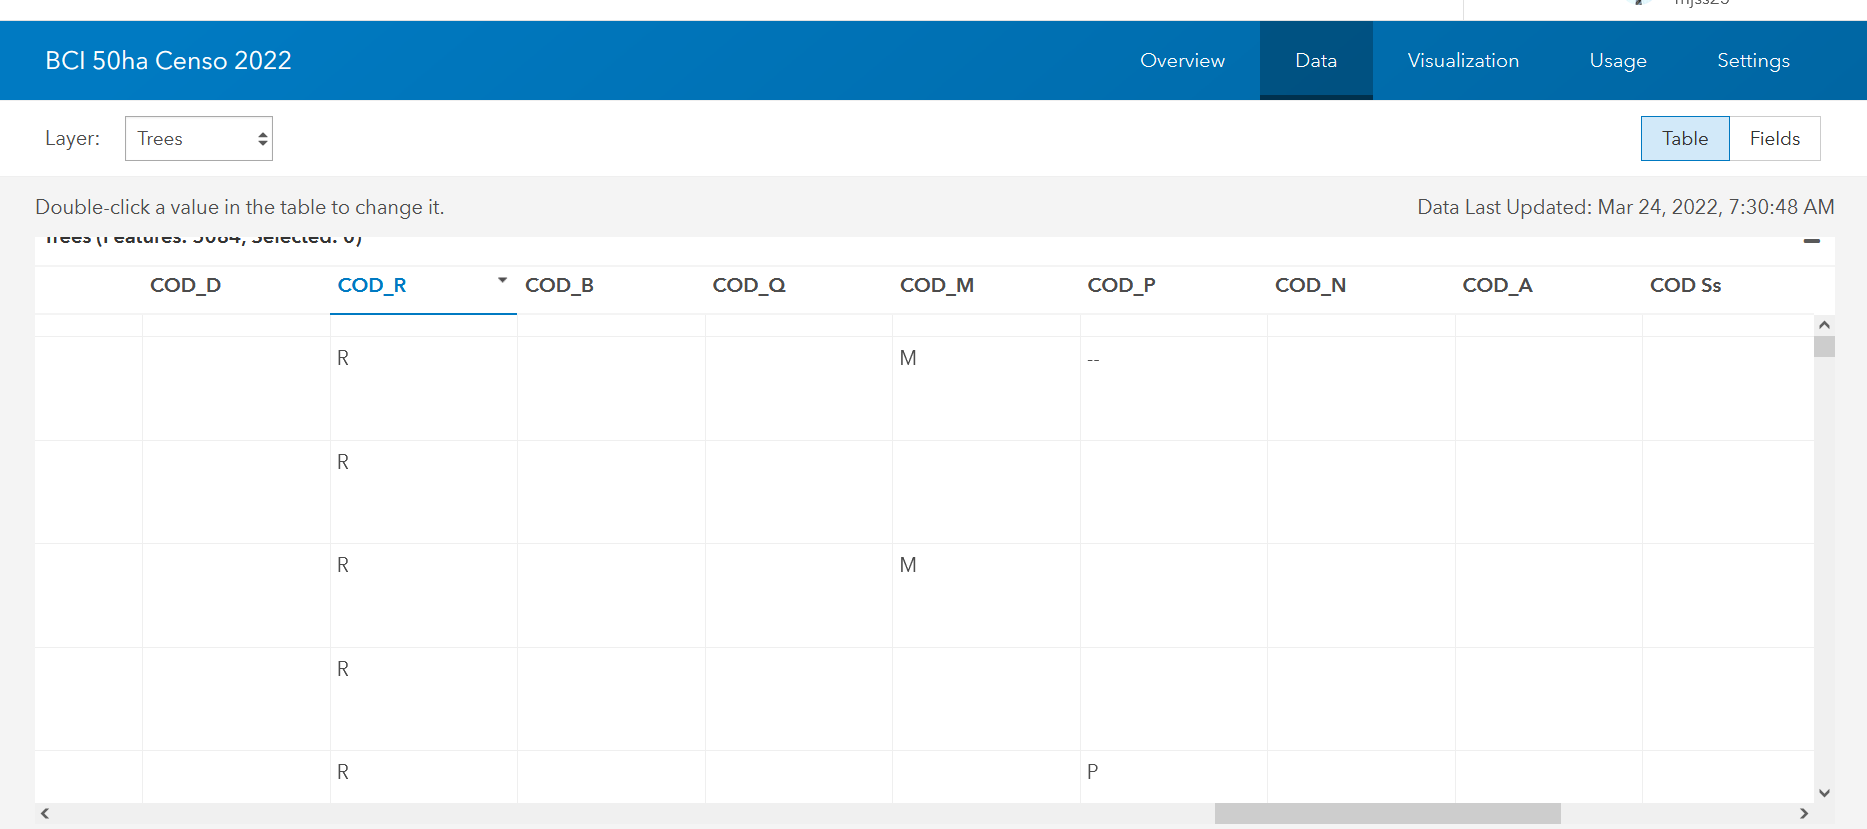
I have this expression on my map popup window to show in one field, the content from 8 different fields (see screenshot below):
Trim(Concatenate([$feature["COD_A"],
$feature["COD_B"],
$feature["COD_D"],
$feature["COD_L"],
$feature["COD_M"],
$feature["COD_N"],
$feature["COD_P"],
$feature["COD_Q"],
$feature["COD_R"],
], ''))
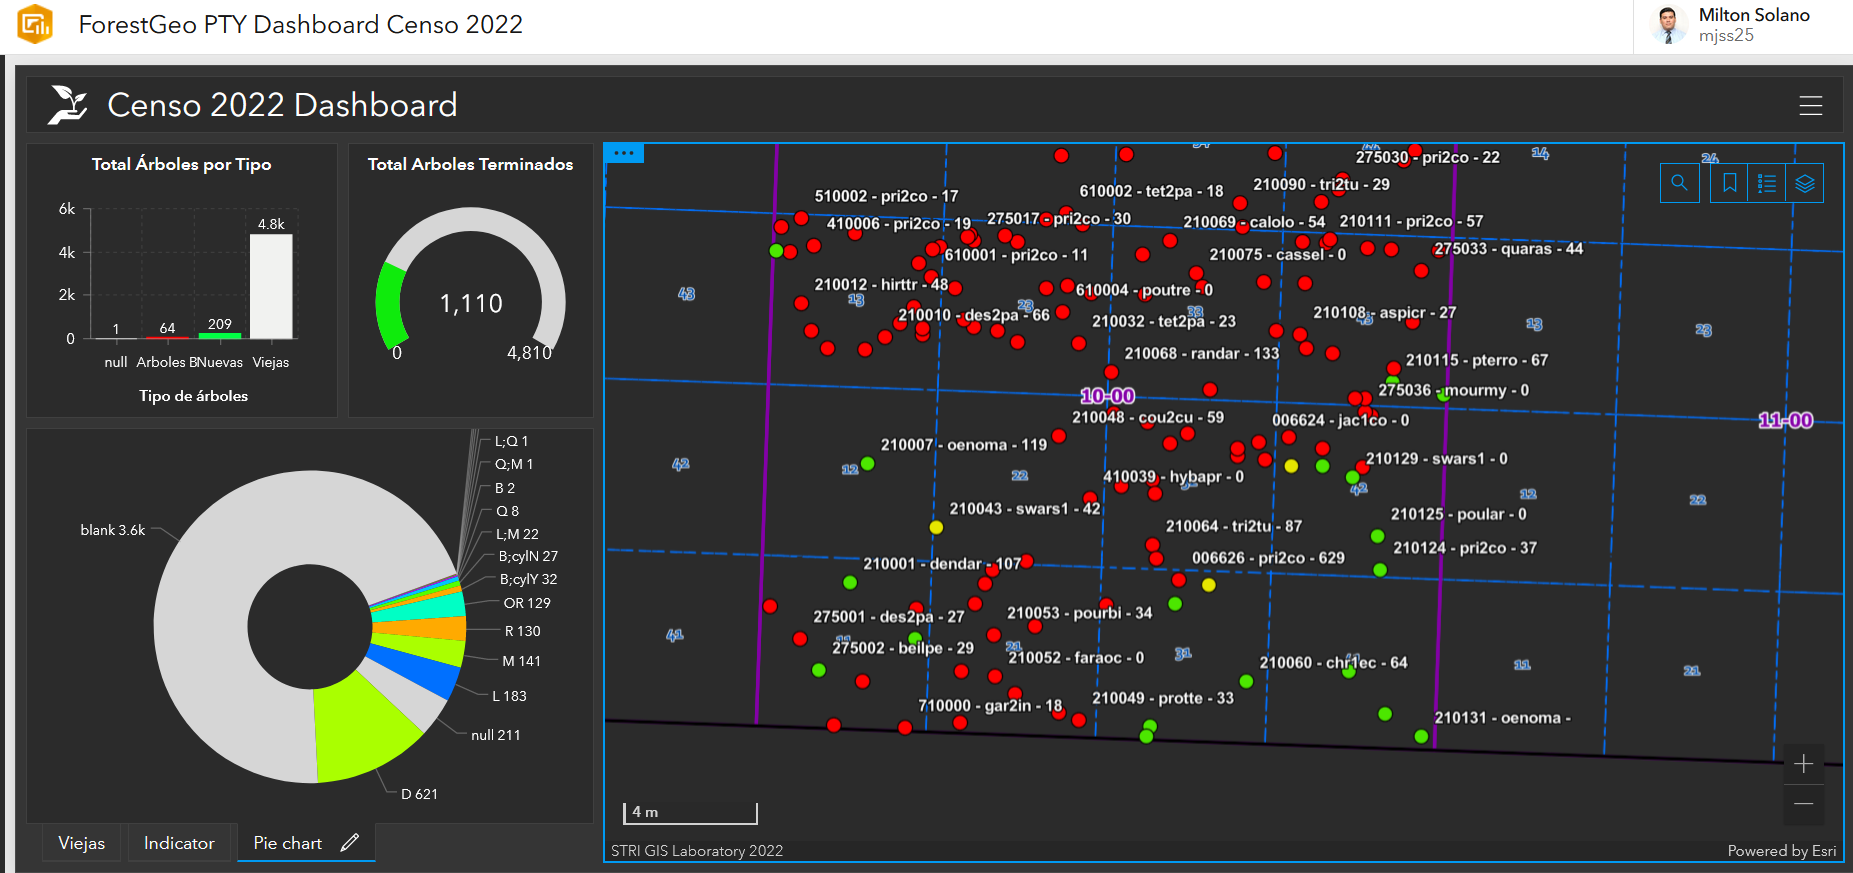
I'm trying to create a graph on my dashboard to show exactly this expression (See the screenshot with the Pie Chart as example). The graph will show how many variations of the codes are in the database (ex. LR - 10, BQ-5, RB-2, D-15, etc.). The field expression is not available in Dashboards, so I can't use the expression. I tried Data Expressions but I can't figure out how to do it.
Can you help me to figure out how to achieve this? thanks in advance!
Milton
Solved! Go to Solution.
Accepted Solutions
- Mark as New
- Bookmark
- Subscribe
- Mute
- Subscribe to RSS Feed
- Permalink
Data Expressions can be a lot to wrap your head around, but it's totally the way to go. This will allow you to create a "virtual" field in your data that a chart can interact with.
var fs = FeatureSetByPortalItem(
    Portal('your-portal-url'),
    'itemid of feature service',
    0, // or whatever the layer index
    ['*'],
    false
)

// Get existing fields
var fields = Schema(fs)['fields']

// Push new feature into field array
Push(
    fields,
    {name: 'concat_vals', type: 'esriFieldTypeString'}
)

// Create dictionary to hold output features
var out_dict = {
    fields: fields,
    geometryType: '',
    features: []
}

// Iterate over features, concatenating fields and pushing into feature array
for (var f in fs){

    // Get feature as dict
    var feat = Dictionary(Text(f))

    // // Values to concatenate
    var concat_arr = [
        f['COD_A'],
        f['COD_B'],
        f['COD_D'],
        f['COD_L'],
        f['COD_M'],
        f['COD_N'],
        f['COD_P'],
        f['COD_Q'],
        f['COD_R']
    ]

    // // Concatenate values to string
    var concat_str = Trim(Concatenate(concat_arr, ''))

    // // Add concat field to feature dict
    feat['attributes']['concat_vals'] = concat_str

    Push(
        out_dict['features'],
        feat
    )
}

// Return populated dict
return FeatureSet(Text(out_dict))
I tested this against another layer, and it successfully returns a "concat_vals" field, which your chart would then be able to see.

Kendall County GIS
- Mark as New
- Bookmark
- Subscribe
- Mute
- Subscribe to RSS Feed
- Permalink
Data Expressions can be a lot to wrap your head around, but it's totally the way to go. This will allow you to create a "virtual" field in your data that a chart can interact with.
var fs = FeatureSetByPortalItem(
    Portal('your-portal-url'),
    'itemid of feature service',
    0, // or whatever the layer index
    ['*'],
    false
)

// Get existing fields
var fields = Schema(fs)['fields']

// Push new feature into field array
Push(
    fields,
    {name: 'concat_vals', type: 'esriFieldTypeString'}
)

// Create dictionary to hold output features
var out_dict = {
    fields: fields,
    geometryType: '',
    features: []
}

// Iterate over features, concatenating fields and pushing into feature array
for (var f in fs){

    // Get feature as dict
    var feat = Dictionary(Text(f))

    // // Values to concatenate
    var concat_arr = [
        f['COD_A'],
        f['COD_B'],
        f['COD_D'],
        f['COD_L'],
        f['COD_M'],
        f['COD_N'],
        f['COD_P'],
        f['COD_Q'],
        f['COD_R']
    ]

    // // Concatenate values to string
    var concat_str = Trim(Concatenate(concat_arr, ''))

    // // Add concat field to feature dict
    feat['attributes']['concat_vals'] = concat_str

    Push(
        out_dict['features'],
        feat
    )
}

// Return populated dict
return FeatureSet(Text(out_dict))
I tested this against another layer, and it successfully returns a "concat_vals" field, which your chart would then be able to see.
Kendall County GIS
- Mark as New
- Bookmark
- Subscribe
- Mute
- Subscribe to RSS Feed
- Permalink
Wonderful Josh,
it worked straight from the forum! Thank you for taking the time to help with this.
Milton