- Home
- :
- All Communities
- :
- Products
- :
- ArcGIS Dashboards
- :
- ArcGIS Dashboards Questions
- :
- Graph/Count Widget for Filtered Features only
- Subscribe to RSS Feed
- Mark Topic as New
- Mark Topic as Read
- Float this Topic for Current User
- Bookmark
- Subscribe
- Mute
- Printer Friendly Page
Graph/Count Widget for Filtered Features only
- Mark as New
- Bookmark
- Subscribe
- Mute
- Subscribe to RSS Feed
- Permalink
Hi Joe,
In the desktop Operations Dashboard views, the limitation is that only one data source can be used. For this data source, it can be shown as features, attributes or feature counts.
Have you tried using the new Operation Dashboard (beta)? In the serial charts, you can use the new Grouped Values for category, which may cut down on the number of filters you need to get the results.
Let me know if you have any questions!
Chris
- Mark as New
- Bookmark
- Subscribe
- Mute
- Subscribe to RSS Feed
- Permalink
How do I upgrade to the Beta?
- Mark as New
- Bookmark
- Subscribe
- Mute
- Subscribe to RSS Feed
- Permalink
You can officially sign up for the beta here, where you have access to documentation, beta user forums, updates, etc. But to begin using the software, you just need to sign into your ArcGIS Online org to get started. The details are outlined here: https://community.esri.com/community/gis/applications/operations-dashboard-for-arcgis/blog/2017/08/0...
- Mark as New
- Bookmark
- Subscribe
- Mute
- Subscribe to RSS Feed
- Permalink
is this a new download? I dont see an option to download the beta
- Mark as New
- Bookmark
- Subscribe
- Mute
- Subscribe to RSS Feed
- Permalink
The next evolution of Operations Dashboard is completely browser based and it is integrated with ArcGIS Online. There is no need to download anything. Once you sign into your ArcGIS Online account, you can use the app switcher in the top right to launch Operations Dashboard (Beta) among other apps.
- Mark as New
- Bookmark
- Subscribe
- Mute
- Subscribe to RSS Feed
- Permalink
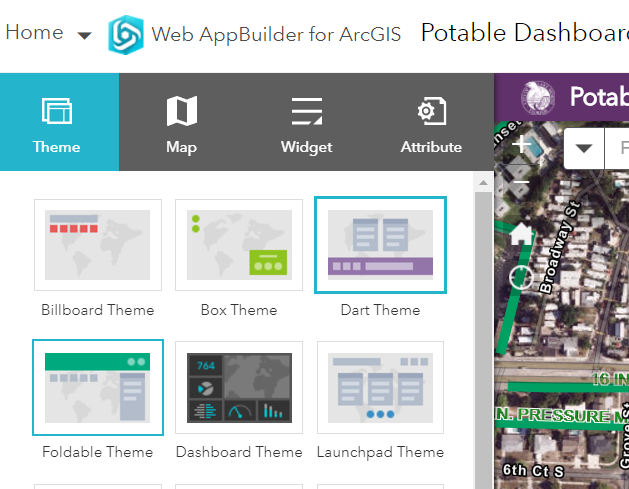
the dashboard theme?

- Mark as New
- Bookmark
- Subscribe
- Mute
- Subscribe to RSS Feed
- Permalink
also the filter widget does not let me use the same schema as the desktop version. I need to apply a filter that uses a date/time field and is within 30 days of current time. This filter widget in the browser does not have that option?
- Mark as New
- Bookmark
- Subscribe
- Mute
- Subscribe to RSS Feed
- Permalink
No, that is a template that can be used in Web App Builder. This is the app switcher as shown below. Clicking on "Operations Dashboard for ArcGIS" will launch the app and allow you to browse existing dashboards and create dashboards.

- Mark as New
- Bookmark
- Subscribe
- Mute
- Subscribe to RSS Feed
- Permalink
OK cool I got it. The filters are raising errors "Missing translation: errors.Error: Error performing query operation"
field: Last_edited_date is within last 30 days.
this same exact query works in the desktop version.