- Home
- :
- All Communities
- :
- Products
- :
- ArcGIS Dashboards
- :
- ArcGIS Dashboards Questions
- :
- Extensions not working in debug mode
- Subscribe to RSS Feed
- Mark Topic as New
- Mark Topic as Read
- Float this Topic for Current User
- Bookmark
- Subscribe
- Mute
- Printer Friendly Page
- Mark as New
- Bookmark
- Subscribe
- Mute
- Subscribe to RSS Feed
- Permalink
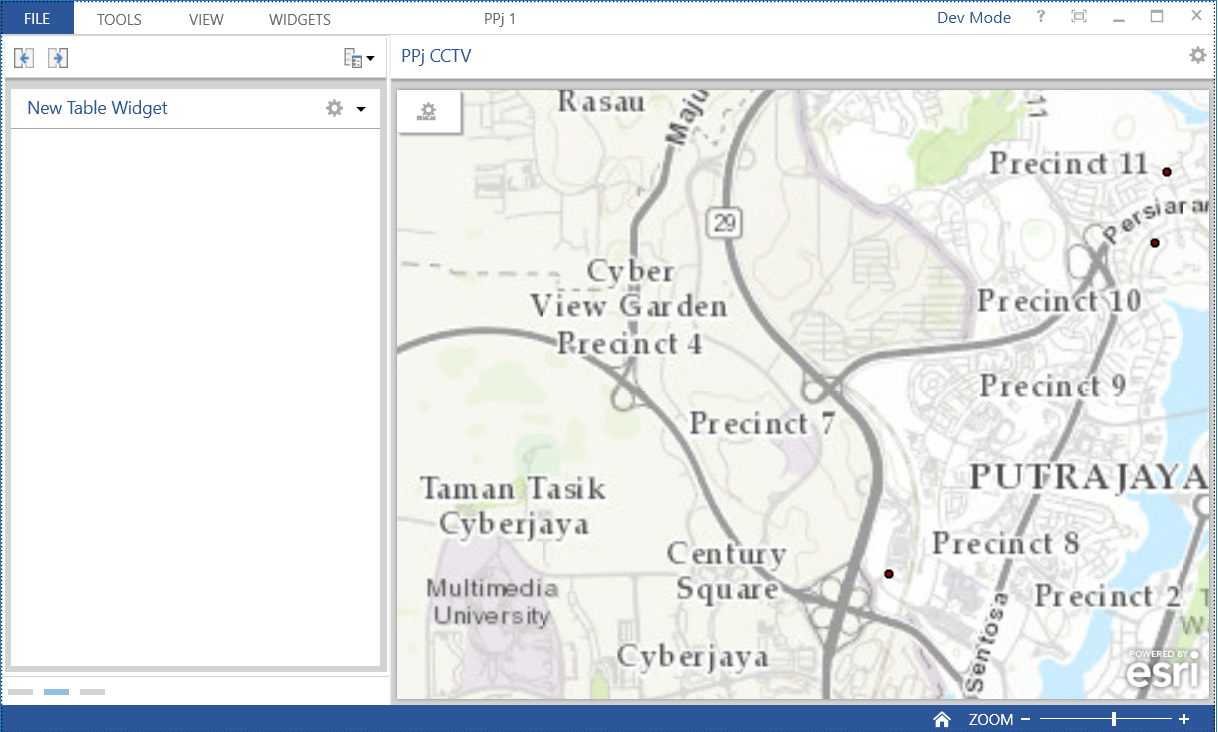
HI, I'm trying the dashboard extensions from https://github.com/Esri/dashboard-samples. In debug mode, after i added e.g. a table widget into the dashboard, all i get is a a blank space. This is using the latest operations Dashboard 10.3.4.1523. How do i get a custom extension working again? I last tried it late last year, it was working then.
Solved! Go to Solution.
Accepted Solutions
- Mark as New
- Bookmark
- Subscribe
- Mute
- Subscribe to RSS Feed
- Permalink
Hi Ken,
Can you try the solution in this KB article?
I think this is what is causing your issue.
Thanks,
Chris
- Mark as New
- Bookmark
- Subscribe
- Mute
- Subscribe to RSS Feed
- Permalink
Can you try the following:
- If you are signed into the org using https, please try using http
- do other extensions work?
- Click the triangle on the widget to launch debug. do you have any errors?
- What OS are you using?
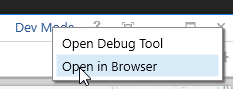
- If you save it and launch the browser, does that work?

Thanks!
Chris
- Mark as New
- Bookmark
- Subscribe
- Mute
- Subscribe to RSS Feed
- Permalink
Hi Chris,
1) Used http for my portal, still didn't work
2) Nope, no extension work. I tried to build my own simple one, also didn't work.
3) The debug window appears blank to me as well
4) Win 10
5) Yes, browser mode works; it's the only way i can proceed with my development now.
Regards,
Ken Moey
- Mark as New
- Bookmark
- Subscribe
- Mute
- Subscribe to RSS Feed
- Permalink
Hi Ken,
Can you try the solution in this KB article?
I think this is what is causing your issue.
Thanks,
Chris
- Mark as New
- Bookmark
- Subscribe
- Mute
- Subscribe to RSS Feed
- Permalink
That actually worked. So operations dashboard needs the gpu, if two graphics cards are presnet.