- Home
- :
- All Communities
- :
- Developers
- :
- ArcGIS API for Python
- :
- ArcGIS API for Python Questions
- :
- Re: how to draw a buffer on the map??
- Subscribe to RSS Feed
- Mark Topic as New
- Mark Topic as Read
- Float this Topic for Current User
- Bookmark
- Subscribe
- Mute
- Printer Friendly Page
- Mark as New
- Bookmark
- Subscribe
- Mute
- Subscribe to RSS Feed
- Permalink
Hi,
Has anyone ever tried to draw a buffer on the map using geometry.buffer in ArcGIS API for Python?
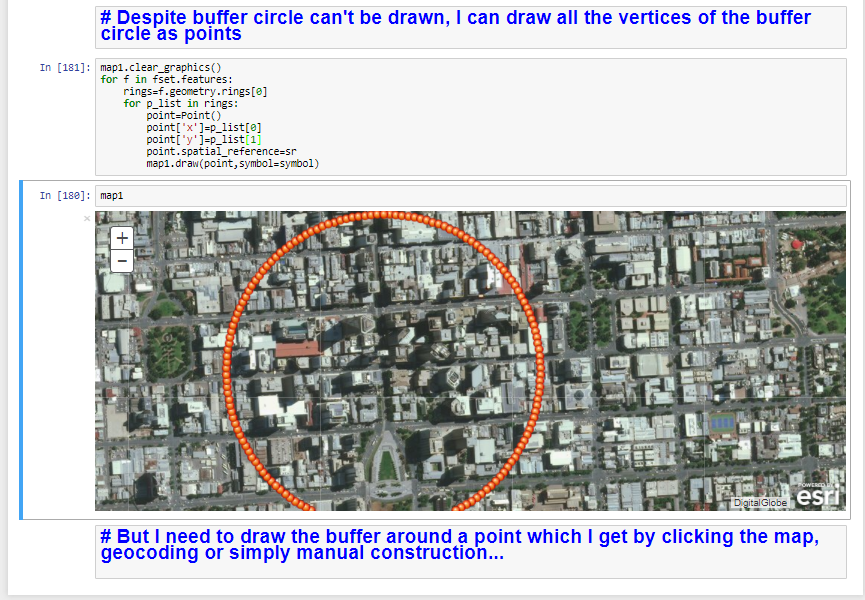
I can draw a point or a simple polygon on the map, but when I try to draw a buffer,a circle around a point, which is a polygon in essence, it won't be dawn, nor does it return me any warning or error.
I am stuck and puzzled...
screenshots are attached, any advice and suggestions are highly appreciated.
Solved! Go to Solution.
Accepted Solutions
- Mark as New
- Bookmark
- Subscribe
- Mute
- Subscribe to RSS Feed
- Permalink
There were some errors in code shown in the screenshot. I tried to tidy up the code and did some copy and paste before I did the snipping.
I figured out why the buffer was not drawn:
It was because of the projection, the input feature needs to be projected. (the documentation of the API needs to be improved, I have to dive into their source code to find the acceptable input feature types ... )
Here is the working code:
Use the default coordinate system (4326)
sr= {"wkid": 102100, "latestWkid": 3857} sr2={"wkid":4326} #Adelaide = geocode("Adelaide, South Australia",out_sr=sr,as_featureset=False)[0] Adelaide = geocode("Adelaide, South Australia")[0] map1.height = '650px' map1.center=(Adelaide['location']['y'],Adelaide['location']['x']) map1.zoom=14p=Point(Adelaide['location'])map1.clear_graphics() symbol = {"angle":0,"xoffset":0,"yoffset":0,"type":"esriPMS","url":"http://static.arcgis.com/images/Symbols/Basic/RedSphere.png", "contentType":"image/png","width":24,"height":24} #draw the pointmap1.draw(p,symbol=symbol)#important, project the location before buffering _p=project([p],in_sr=sr2,out_sr=sr)[0] fill={"type": "esriSFS", "style": "esriSFSSolid", "color": [255,0,0,255]} buf=buffer(geometries=[_p],in_sr=sr,distances=[500],unit='Meters')#this is the key buf[0]['spatialReference']=sr f=Feature(buf[0]) fset=FeatureSet([f],spatial_reference=sr)map1.clear_graphics() map1.draw(fset,symbol=fill) map1.draw(p,symbol=symbol)
- Mark as New
- Bookmark
- Subscribe
- Mute
- Subscribe to RSS Feed
- Permalink
Thanks Shan.
The use_proximity.create_buffers works. but it's not straight-forward. according to the source code of the API, it should accept geocode result as an input feature, but that will cause and error.
reconstruct the result as a tuple works.
Adelaide = geocode("Adelaide, South Australia")[0]
prox=use_proximity.create_buffers((Adelaide['location']['y'],Adelaide['location']['x']),distances=[10],units='Miles')
map1.add_layer(prox)
- Mark as New
- Bookmark
- Subscribe
- Mute
- Subscribe to RSS Feed
- Permalink
Hi Simo,
This is very helpful, but how could I use "use_proximity.create_buffers" with a list of address?
lets say I have:
list=['address1','address2','address3']
a=batch_geocode(list)
for address in a:
dict=a[0]['location']
x=dict["x"]
y=dict["y"]
prox=use_proximity.create_buffers((y,x),distances=[10],units='Miles')[0]
m1.add_layer(prox)
This method shows only one buffer of the last address, and this is expected because m1.add_layer(prox) will be the last address!
I tried to pass the batch geocode results but I got this error:
"
Invalid format of input layer. url string, feature service Item, feature service instance or dict supported
"
Thank you,
Ahmad
- Mark as New
- Bookmark
- Subscribe
- Mute
- Subscribe to RSS Feed
- Permalink
addresses = ['Adelaide, South Australia',
            'Mount Barker, South Australia',
            'Brookside St, Oakden,South Australia']
results = batch_geocode(addresses)

fs=[Feature(geometry=Geometry(res['location'])) for res in results]
fset = FeatureSet(fs)

sms = {
    "color": [255,0,0,150],
    "size": 10,
    "angle": 0,
    "xoffset": 0,
    "yoffset": 0,
    "type": "simple-marker",
    "outline": {
        "color": [
            255,
            255,
            255,
            255
        ],
        "width": 1,
        "type": "esriSLS",
        "style": "esriSLSSolid"
    }
}

for res in results:
    map1.draw(res['location'],symbol=sms)

prox=use_proximity.create_buffers(fset.to_dict(),distances=[1],units='Miles')
map1.add_layer(prox)- Mark as New
- Bookmark
- Subscribe
- Mute
- Subscribe to RSS Feed
- Permalink
There were some errors in code shown in the screenshot. I tried to tidy up the code and did some copy and paste before I did the snipping.
I figured out why the buffer was not drawn:
It was because of the projection, the input feature needs to be projected. (the documentation of the API needs to be improved, I have to dive into their source code to find the acceptable input feature types ... )
Here is the working code:
Use the default coordinate system (4326)
sr= {"wkid": 102100, "latestWkid": 3857} sr2={"wkid":4326} #Adelaide = geocode("Adelaide, South Australia",out_sr=sr,as_featureset=False)[0] Adelaide = geocode("Adelaide, South Australia")[0] map1.height = '650px' map1.center=(Adelaide['location']['y'],Adelaide['location']['x']) map1.zoom=14p=Point(Adelaide['location'])map1.clear_graphics() symbol = {"angle":0,"xoffset":0,"yoffset":0,"type":"esriPMS","url":"http://static.arcgis.com/images/Symbols/Basic/RedSphere.png", "contentType":"image/png","width":24,"height":24} #draw the pointmap1.draw(p,symbol=symbol)#important, project the location before buffering _p=project([p],in_sr=sr2,out_sr=sr)[0] fill={"type": "esriSFS", "style": "esriSFSSolid", "color": [255,0,0,255]} buf=buffer(geometries=[_p],in_sr=sr,distances=[500],unit='Meters')#this is the key buf[0]['spatialReference']=sr f=Feature(buf[0]) fset=FeatureSet([f],spatial_reference=sr)map1.clear_graphics() map1.draw(fset,symbol=fill) map1.draw(p,symbol=symbol)