- Home
- :
- All Communities
- :
- Industries
- :
- Education
- :
- Education Blog
- :
- Teaching about Racial Equity and Social Justice Us...
Teaching about Racial Equity and Social Justice Using GIS and Spatial Data, Part 1
- Subscribe to RSS Feed
- Mark as New
- Mark as Read
- Bookmark
- Subscribe
- Printer Friendly Page
- Report Inappropriate Content
For centuries, maps have inspired people to explore and to investigate places of importance to them. In our modern world, maps are still used for exploration—of issues and challenges that we face. One group of relevant and serious issues are racial equity and social justice. Nowadays, maps are made using Geographic Information Systems (GIS) software and digital spatial data.
Esri has re-committed itself to building tools, technology, and expertise that support efforts towards a more equitable and just world. Esri provides leading location technology and services that undergird collaborative efforts to advance equity and quality of life for everyone. Many users of Esri technology, already working to create a more just society, have shown that GIS can be a critical tool for launching social justice initiatives because it helps organizations define needs and plan projects for alleviating racial inequity.
One way to start exploring how GIS can be used to understand and take action in these areas is with the Esri Racial Equity set of resources. These resources include (1) The Racial Equity community outreach solution. This solution is a series of ArcGIS applications used to communicate key equity initiatives or programs, ways to visualize workforce diversity metrics, tools to gauge public sentiment, and ways to share authoritative information about the issues with the community, such as workforce, government services, policing, and economic inclusion. (2) The Racial Equity GIS Hub. ArcGIS Hub is a cloud-based engagement platform that enables people and organizations to communicate more effectively with their communities. You can use Hub to create a web site that is more than just a list of data or information, but rather, one that aggregates resources, starts conversations, and engages the community. The Racial Equity GIS Hub is a continually expanding set of information—data layers, maps, applications, training resources, best practice articles, solutions, and examples of how people from around the world are leveraging GIS to address racial inequities. (3) Relevant data sources. GIS and maps are only as good as the information behind them. The data sources included here that you can use range from local to international in scale from nonprofit organizations, government agencies, academia, and private companies, but the resources also show you how to create your own data. Once you have the data in hand, the site also shows you how to create web maps, story maps, infographics, dashboards, and other ways you can analyze your data and communicate effectively.
One way to apply GIS to racial equity and social justice is with the Esri Maps for Public Policy, or “policy maps.” According to Stephen Goldsmith, former mayor of Indianapolis and professor at the Harvard University Kennedy School of Government, “A policy map clearly shows where there is an opportunity to intervene.” This growing collection of maps and other content includes social equity, health, economic opportunity, resilience, sustainability, environment and natural resources, and public safety. As I describe in this essay, you can explore these policy maps not only to build a collection of interest to you, but you can also explore best practices and datasets for your research, analysis, and policy recommendations. Perhaps best of all, you can modify the collections you build, and share them, to help others see what you are seeing, to get feedback, to build community.
Within a matter of minutes, you can build a collection of your own about topics you care about. It could be affordable housing, employment, green spaces, air quality, crime, access to computers or the internet, senior population, graffiti, invasive species, homelessness, or COVID or other health variables. But GIS is more than just “mapping”. Since its inception, GIS has provided a set of tools, a rich array of data, and most importantly, a framework for solving relevant and pressing problems. GIS can help students, instructors, and researchers learn about the central issues of racial equity and social justice, why they are serious, their spatial and temporal patterns, and most importantly, form action plans on how to solve them.

Example set of policy maps.
Let’s get specific. This sample set of 5 maps covers topics of racial disparities in home ownership, the 1930s Home Owners’ Loan Corporation’s redlining policies, the unemployment rate, the COVID-19 mortality rate, and the particulate air pollution, as described by my colleague Lisa Berry. In our rapidly changing world, people rightly want to see data that is occurring right now or is as close to real-time as possible. Some of these maps cover current data, such as the unemployment rate in the above collection, and others, such as air pollution, cover an 18-year period. For additional policy mapping ideas, see these 10 tips.
The policy maps data and layers are only the tip of the iceberg. Thousands of additional variables and map layers are at your fingertips in ArcGIS Online, other data portals, and in the ArcGIS Living Atlas of the World. Wondering where to start? I recommend starting with Policy Maps, as described above, and next, start browsing the ArcGIS Living Atlas of the World.
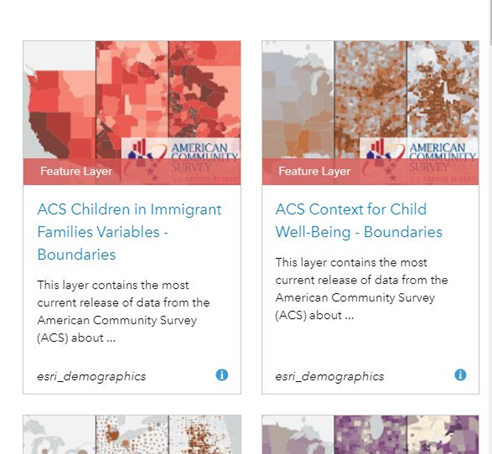
A selection of the many relevant layers for social justice in the ArcGIS Living Atlas of the World.
I look forward to your comments about how you might be using these resources in your own work, or any questions that you may have.
You must be a registered user to add a comment. If you've already registered, sign in. Otherwise, register and sign in.
-
Administration
58 -
Announcements
65 -
Career & Tech Ed
1 -
Curriculum-Learning Resources
226 -
Education Facilities
24 -
Events
60 -
GeoInquiries
1 -
Higher Education
557 -
Informal Education
272 -
Licensing Best Practices
64 -
National Geographic MapMaker
25 -
Pedagogy and Education Theory
206 -
Schools (K - 12)
282 -
Schools (K-12)
230 -
Spatial data
28 -
STEM
3 -
Students - Higher Education
240 -
Students - K-12 Schools
114 -
Success Stories
33 -
TeacherDesk
1 -
Tech Tips
92
- « Previous
- Next »