Turn on suggestions
Auto-suggest helps you quickly narrow down your search results by suggesting possible matches as you type.
Cancel
- Home
- :
- All Communities
- :
- Products
- :
- Geoprocessing
- :
- Geoprocessing Questions
- :
- Feature comparison scenario
Options
- Subscribe to RSS Feed
- Mark Topic as New
- Mark Topic as Read
- Float this Topic for Current User
- Bookmark
- Subscribe
- Mute
- Printer Friendly Page
Feature comparison scenario
Subscribe
4701
7
09-06-2013 09:25 PM
09-06-2013
09:25 PM
- Mark as New
- Bookmark
- Subscribe
- Mute
- Subscribe to RSS Feed
- Permalink
I am trying to find differences among polygon features between two sets of data. For the sake of simplicity, I drew a little diagram . Let's say there is a county that consists of four cities: Alpha Ville, Beta Ville, Gamma Ville, and Delta Ville. In 2003, each city occupied a quadrant of the county. Fast forward to 2013 and there have been some changes. First, Gamma Ville has changed its name to Gummy Ville. Second, the coverage of Beta Ville and Delta Ville have shifted.
My diagram - and the portions highlighted in green and purple - show differences between the shapefiles. These highlighted areas are the output I hope to achieve.
What operations can I use to do this? I tried Feature Compare (Data Management) because that very much sounds like what I intend, but I keep getting the error, "Table row counts are different". However, I know that my comparison files will have different numbers of features; that is part of why I want to make the comparison, to see changes in existence, geometry, and/or names of all features.
Thanks in advance for your help!
7 Replies
09-07-2013
07:11 AM
- Mark as New
- Bookmark
- Subscribe
- Mute
- Subscribe to RSS Feed
- Permalink
Try the union tool http://resources.arcgis.com/en/help/main/10.1/index.html#//00080000000s000000
Thanks for replying, Luke. The Union tool merges the two feature sets, but I want to highlight the differences, not obscure them. I also tried the Symmetrical Difference tool, but that only outputs the collective differences between the entire data sets. I want to know where and how each feature has changed between sets. Hopefully, this intent comes through in the diagram I linked.
09-07-2013
09:55 AM
- Mark as New
- Bookmark
- Subscribe
- Mute
- Subscribe to RSS Feed
- Permalink
Thanks for replying, Luke. The Union tool merges the two feature sets, but I want to highlight the differences, not obscure them. I also tried the Symmetrical Difference tool, but that only outputs the collective differences between the entire data sets. I want to know where and how each feature has changed between sets. Hopefully, this intent comes through in the diagram I linked.
You need to intesect two feature classes, then summarize the output fields.
09-07-2013
01:35 PM
- Mark as New
- Bookmark
- Subscribe
- Mute
- Subscribe to RSS Feed
- Permalink
If you use the union tool, the output attribute table will contain all attributes from both input feature classes so can be used to identify areas that haven't changed and those that have, and what they have changed to and from.
09-08-2013
05:34 PM
- Mark as New
- Bookmark
- Subscribe
- Mute
- Subscribe to RSS Feed
- Permalink
For example:
Time 1 (2003):
[ATTACH=CONFIG]27282[/ATTACH]
Time 2 (2013):
[ATTACH=CONFIG]27283[/ATTACH]
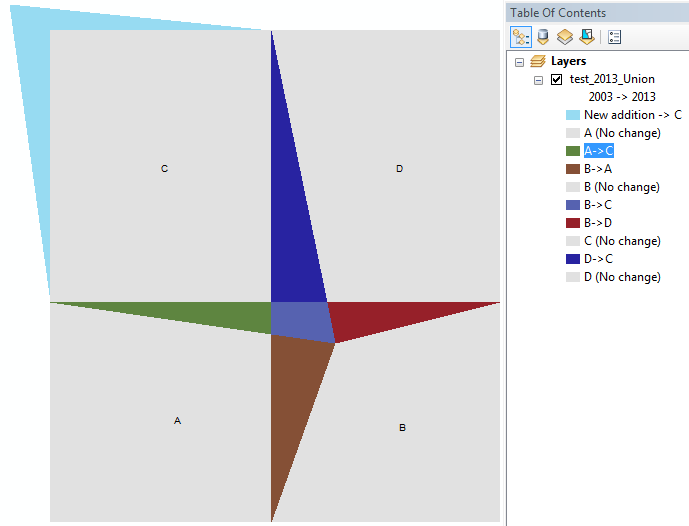
Changes 2003-2013:
[ATTACH=CONFIG]27284[/ATTACH]
The difference image is the output of the Union tool and was symbolised using the "Categories"->"Unique values, many fields" renderer on the 2003 and 2013 name fields.
Time 1 (2003):
[ATTACH=CONFIG]27282[/ATTACH]
Time 2 (2013):
[ATTACH=CONFIG]27283[/ATTACH]
Changes 2003-2013:
[ATTACH=CONFIG]27284[/ATTACH]
The difference image is the output of the Union tool and was symbolised using the "Categories"->"Unique values, many fields" renderer on the 2003 and 2013 name fields.
09-08-2013
06:09 PM
- Mark as New
- Bookmark
- Subscribe
- Mute
- Subscribe to RSS Feed
- Permalink
For example:
Time 1 (2003):
[ATTACH=CONFIG]27285[/ATTACH]
Time 2 (2013):
[ATTACH=CONFIG]27286[/ATTACH]
Changes 2003-2013:
[ATTACH=CONFIG]27287[/ATTACH]
The difference image is the output of the Union tool and was symbolised using the "Categories"->"Unique values, many fields" renderer on the 2003 and 2013 name fields.
09-09-2013
07:11 AM
- Mark as New
- Bookmark
- Subscribe
- Mute
- Subscribe to RSS Feed
- Permalink
Hi
The Data Interoperability extension has a couple of transformers, ChangeDetector and Matcher, that will do this job, allowing you to choose the combination of geometric and attribute difference you think is significant.
Regards
The Data Interoperability extension has a couple of transformers, ChangeDetector and Matcher, that will do this job, allowing you to choose the combination of geometric and attribute difference you think is significant.
Regards