- Home
- :
- All Communities
- :
- Products
- :
- ArcGIS Monitor
- :
- ArcGIS Monitor Questions
- :
- Enhancement Request- Ability to Visually Filter Ch...
- Subscribe to RSS Feed
- Mark Topic as New
- Mark Topic as Read
- Float this Topic for Current User
- Bookmark
- Subscribe
- Mute
- Printer Friendly Page
Enhancement Request- Ability to Visually Filter Chart Information
- Mark as New
- Bookmark
- Subscribe
- Mute
- Subscribe to RSS Feed
- Permalink
- Report Inappropriate Content
Hi ArcGIS Monitor Team,
As you know many times there's a lot of information being displayed on a chart in Monitor (web version) and many times these metrics overlap each other making it difficult to view. It would be really awesome to visually filter out servers/items in a graph via the table below or via a drop down option. Ideally this would look something like how ArcGIS Insights handles visual queries where the item in interest are dark and the rest of the information is transparent/ subdued (similar to the image below)

Just a suggestion for one more way you could improve the usability of your product.
Thanks,
Amanda
- Mark as New
- Bookmark
- Subscribe
- Mute
- Subscribe to RSS Feed
- Permalink
- Report Inappropriate Content
ArcGIS Monitor 10.7x already provides the ability to see isolated charts of a performance metric instead of having metrics from several sources overlapping.
Go to: ArcGIS Monitor website > Site > Catalog
To see metrics on the same chart ( ex. %CPU from all the servers you are monitoring) go to:
ArcGIS Monitor website > Catagories > Infrastructure > specific server (example)
- Mark as New
- Bookmark
- Subscribe
- Mute
- Subscribe to RSS Feed
- Permalink
- Report Inappropriate Content
Hi Amanda Huber,
Thanks so much for the suggestion - we're definitely working on ways to improve the ability to quickly parse through the metric data collected, as you described. There are significant UI refactors coming in the next release, we'll take your suggestion to the team!
Thanks again,
Evan
- Mark as New
- Bookmark
- Subscribe
- Mute
- Subscribe to RSS Feed
- Permalink
- Report Inappropriate Content
Hi Evan Mosby,
I just wanted to reach out to you and see what "significant UI refactors" are still coming?
It appears nothing new was added to the 10.8 release and we're curious what the product road map looks like.
Thanks,
Amanda
- Mark as New
- Bookmark
- Subscribe
- Mute
- Subscribe to RSS Feed
- Permalink
- Report Inappropriate Content
Hi Amanda,
The original schedule did get shifted back, but new features will be going into a Early Adopter program this summer.
- Mark as New
- Bookmark
- Subscribe
- Mute
- Subscribe to RSS Feed
- Permalink
- Report Inappropriate Content
Thanks so much for the update, Evan Mosby! Is there a way for our organization to be a part of that Early Adopter Program?
- Mark as New
- Bookmark
- Subscribe
- Mute
- Subscribe to RSS Feed
- Permalink
- Report Inappropriate Content
Yup yup! We're still getting the details together, but you're now on the list to get contacted. We'll definitely be speaking about this more at UC too.
- Mark as New
- Bookmark
- Subscribe
- Mute
- Subscribe to RSS Feed
- Permalink
- Report Inappropriate Content
Great to hear! Thanks so much.
- Mark as New
- Bookmark
- Subscribe
- Mute
- Subscribe to RSS Feed
- Permalink
- Report Inappropriate Content
Hi Evan Mosby,
I just wanted to circle back around on this question- we're still having issue with visually differentiating these servers in the charts because of all the metrics being so close together. We really need a way to query the chart by the server to see it's individual trend. Was there an update at the UC for this EAC opportunity?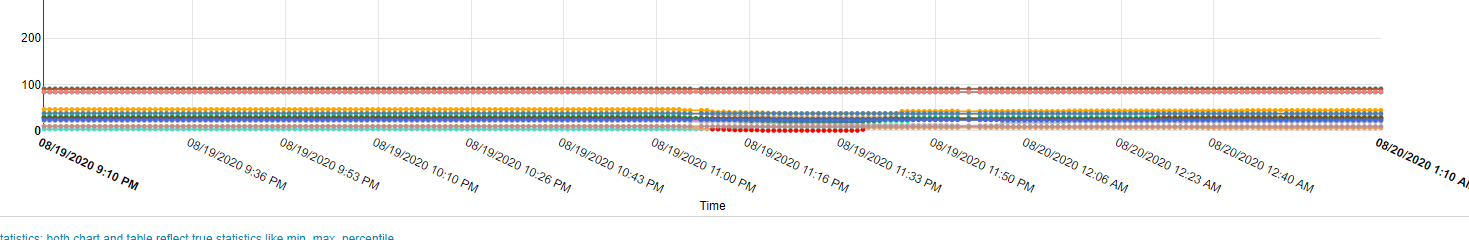 Please take this into consideration.
Thanks,
Amanda
- Mark as New
- Bookmark
- Subscribe
- Mute
- Subscribe to RSS Feed
- Permalink
- Report Inappropriate Content
Hi Amanda Huber
We were just talking about this last week and are happy to report we'll definitely be implementing the enhancement you recommended at the beginning of this thread in 10.9, along with some additional options to help scale the graph when several data series are close together. I saw the early implementation and it looking very promising! This won't necessarily be in the first EA release, but shortly thereafter.
We do have you on the list for the EA - emails will be going out at the end of the month.