- Home
- :
- All Communities
- :
- Developers
- :
- ArcGIS API for Python
- :
- ArcGIS API for Python Questions
- :
- SEDF Class Breaks by Size
- Subscribe to RSS Feed
- Mark Topic as New
- Mark Topic as Read
- Float this Topic for Current User
- Bookmark
- Subscribe
- Mute
- Printer Friendly Page
SEDF Class Breaks by Size
- Mark as New
- Bookmark
- Subscribe
- Mute
- Subscribe to RSS Feed
- Permalink
- Report Inappropriate Content
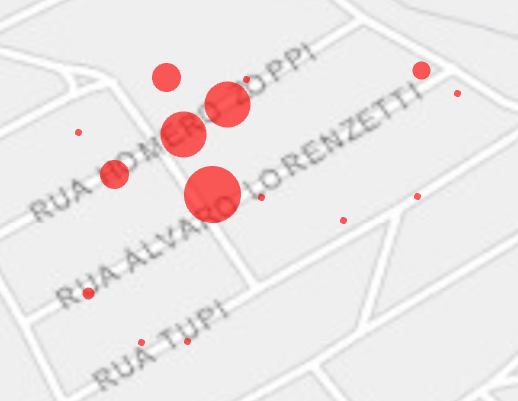
I would like to produce a map like this:
I have a spatially enabled data frame with a column with numeric values (integers). I want vary the size of the symbol by value. I have found documentation for changing colors, which works fine, but I can't figure out how to change size.
Here is my current code:
red_rel.spatial.plot(map_widget= m3,
renderer_type = 'c',
method='esriClassifyNaturalBreaks',
class_count=20,
col='MARK_Red')I imagine it is a matter of changing the 'c' in renderer_type to something else but I haven't figured out what that is. There should also be a way to set a size range.
Many Thanks.
also, is there a way to clear the symbology so each time I run the script it doesn't just overwrite the previous symbology?
ArcGIS API for Python v. 1.6
Jupyter Lab v. 0.35.4
- Mark as New
- Bookmark
- Subscribe
- Mute
- Subscribe to RSS Feed
- Permalink
- Report Inappropriate Content
Hi Benjamin,
I had the same issue and I managed to solve it with a simple renderer and a size variable defined in the visual_variables property. date_zi is my spatially enabled dataframe: 
Although the examples provided in the following link are for the Javascript API for ArcGIS, they work also for the Python API since they are both built upon the ArcGIS REST API. The difference is that for the Python API you need each key to be written between commas: https://developers.arcgis.com/javascript/latest/api-reference/esri-renderers-visualVariables-SizeVar...