- Home
- :
- All Communities
- :
- Developers
- :
- ArcGIS API for Python
- :
- ArcGIS API for Python Questions
- :
- Display array of multiple coordinates (x,y) in the...
- Subscribe to RSS Feed
- Mark Topic as New
- Mark Topic as Read
- Float this Topic for Current User
- Bookmark
- Subscribe
- Mute
- Printer Friendly Page
Display array of multiple coordinates (x,y) in the map object
- Mark as New
- Bookmark
- Subscribe
- Mute
- Subscribe to RSS Feed
- Permalink
Hi,
I have a workflow in which I obtain lat/long from .jpg pictures taken with a drone and obtain an array of multiple lists in which I have the lat and long values. I am thinking of iterate the array, create points using arcgis.geometry.Point method and plot those points in the map object created before. I`m not sure if I should, somehow, create graphics from those points or I should create a feature inside my account and insert the point values as records in the feature and after that add the feature into the map as a layer?
Thanks,
Ionut
Solved! Go to Solution.
Accepted Solutions
- Mark as New
- Bookmark
- Subscribe
- Mute
- Subscribe to RSS Feed
- Permalink
You can do both - i.e. draw graphics on map widget, or create a feature collection from the points and add that to the map widget. Examples of both techniques are shown below:
1) Draw points on a map widget:
sms = {"color": [255,255,0,255], "size": 5, "type": "esriSMS", "style": "esriSMSCircle"}
for lat,lon,title,content in get_coordinates():
    m.draw({'x':lon,'y':lat}, symbol=sms, popup={'title':title,'content':content})

2) Create a FeatureCollection from the points and draw them:
locations = []
path = r'C:\xc\Presentations\GeoPython\Watson\insulators'
# find locations of broken insulators
for file in listdir(path):
    filepath = path + '\\' + file
    if is_broken(filepath):
        locations.append(get_location(filepath))

# import into ArcGIS as a layer
df = pd.DataFrame.from_records(locations)
df.columns = ['x', 'y']
broken_insulators = gis.content.import_data(df)

m.add_layer(broken_insulators)
I like approach 2 as then you can use the FeatureCollection for other purposes such as calling spatial analysis tools:
# get layer of transmission towers
towers = gis.content.search('BPA_TransmissionStructures', 'Feature Layer', outside_org=True)[0]
# find transmission towers near image locations
destinations = join_features(towers, broken_insulators, "withindistance", 0.1, "Miles")
- Mark as New
- Bookmark
- Subscribe
- Mute
- Subscribe to RSS Feed
- Permalink
Hi Rohit,
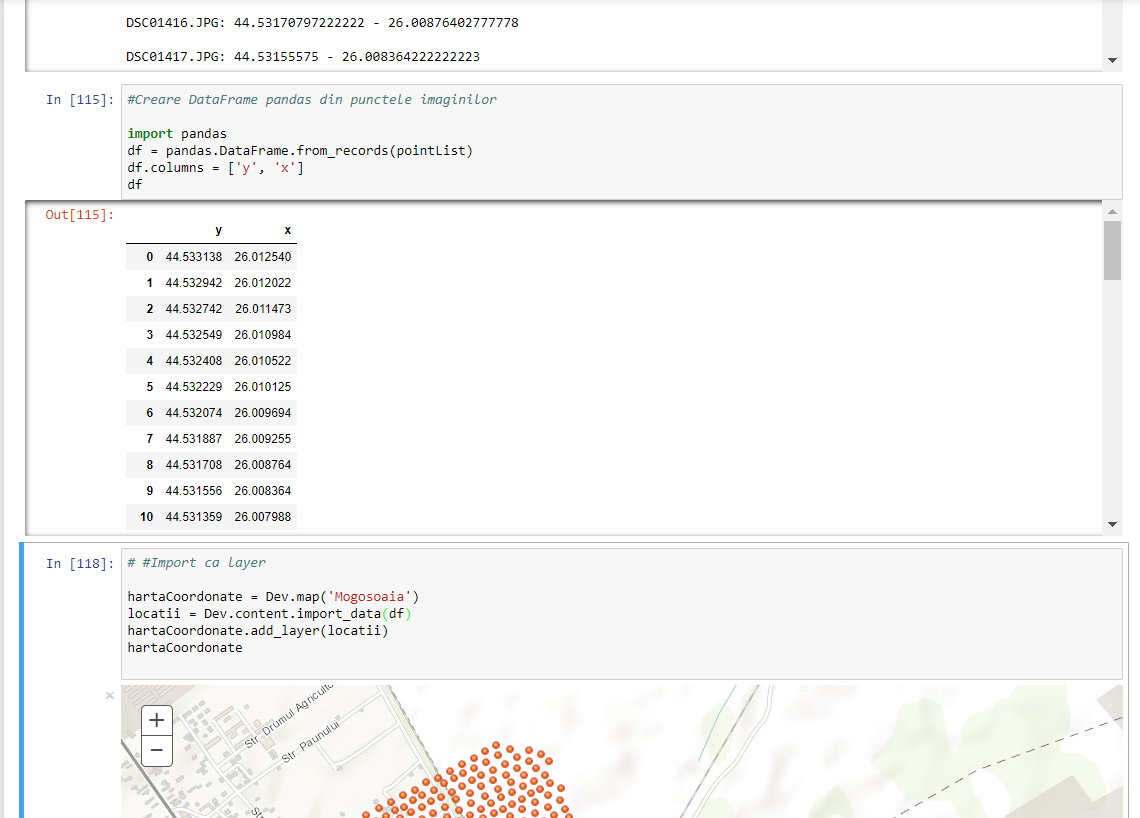
I did with the 2nd option you told me about. Everything is working great. Also, a note, It was only working with coordinates as DD; I tried with DMS and the points don`t plot in the map.
As you can see in picture below, I have DD format coordinates, I put them into a pandas data frame and after I add as layer into the map object.
Thanks!
- Mark as New
- Bookmark
- Subscribe
- Mute
- Subscribe to RSS Feed
- Permalink
Hi,
Thanks so much for the script it helped me get on my way. The issue i am having now is i can't change the symbol of the new layer. How can a add a new point renderer to the newly created layer. I have tried various different methods and the point symbol never changes. I just need it bigger then the default symbol.
If you have any thoughts they will be appreciated.
Thanks,
Matt