- Home
- :
- All Communities
- :
- Developers
- :
- Python
- :
- Python Questions
- :
- Points to line in Arcmap
- Subscribe to RSS Feed
- Mark Topic as New
- Mark Topic as Read
- Float this Topic for Current User
- Bookmark
- Subscribe
- Mute
- Printer Friendly Page
- Mark as New
- Bookmark
- Subscribe
- Mute
- Subscribe to RSS Feed
- Permalink
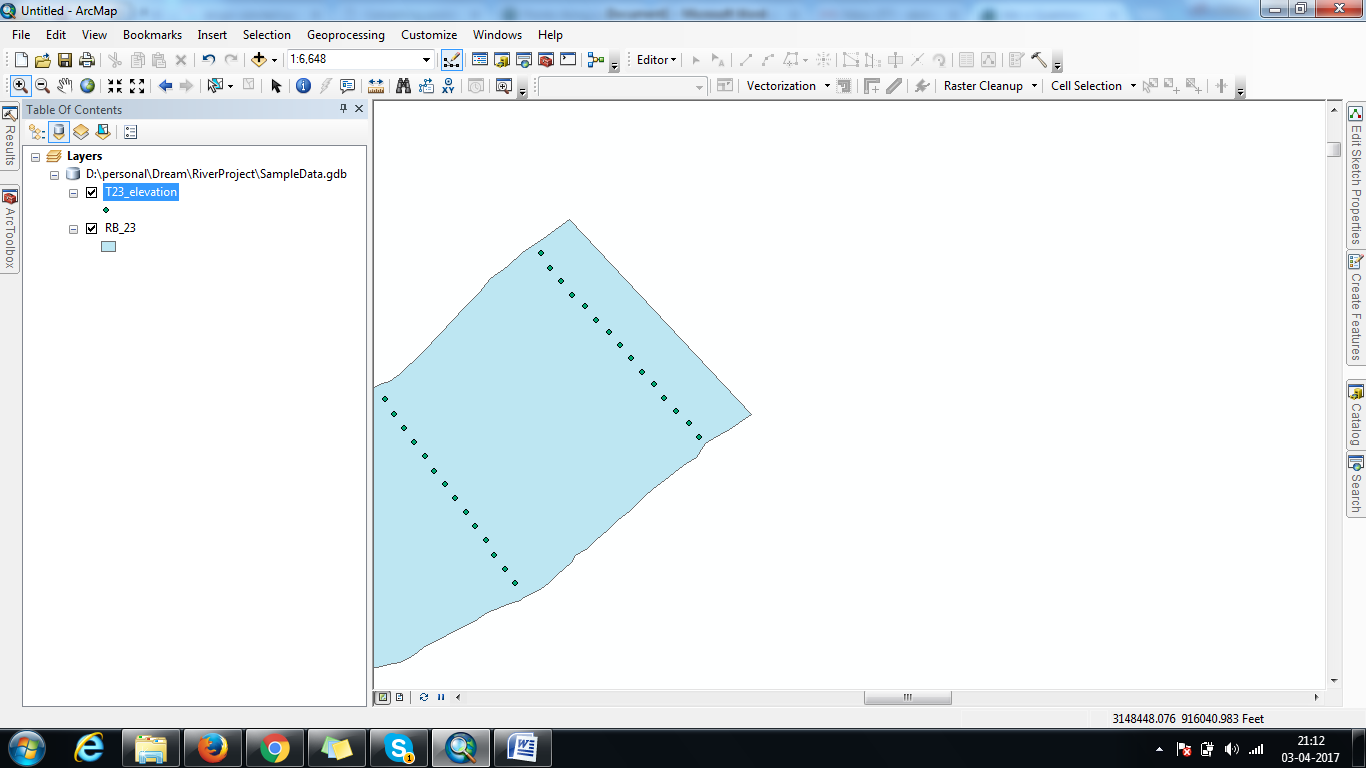
Hi,
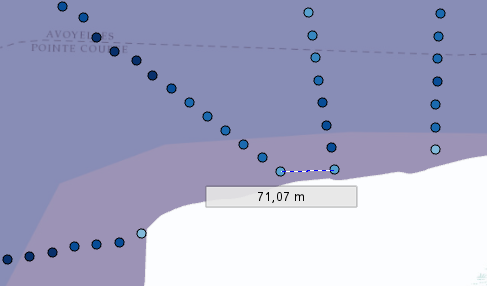
I have a set of points (as shown in the picture). I want to join them and assign unique id to them. How this can be achieved using python or Model Builder on Arcmap 10.5?
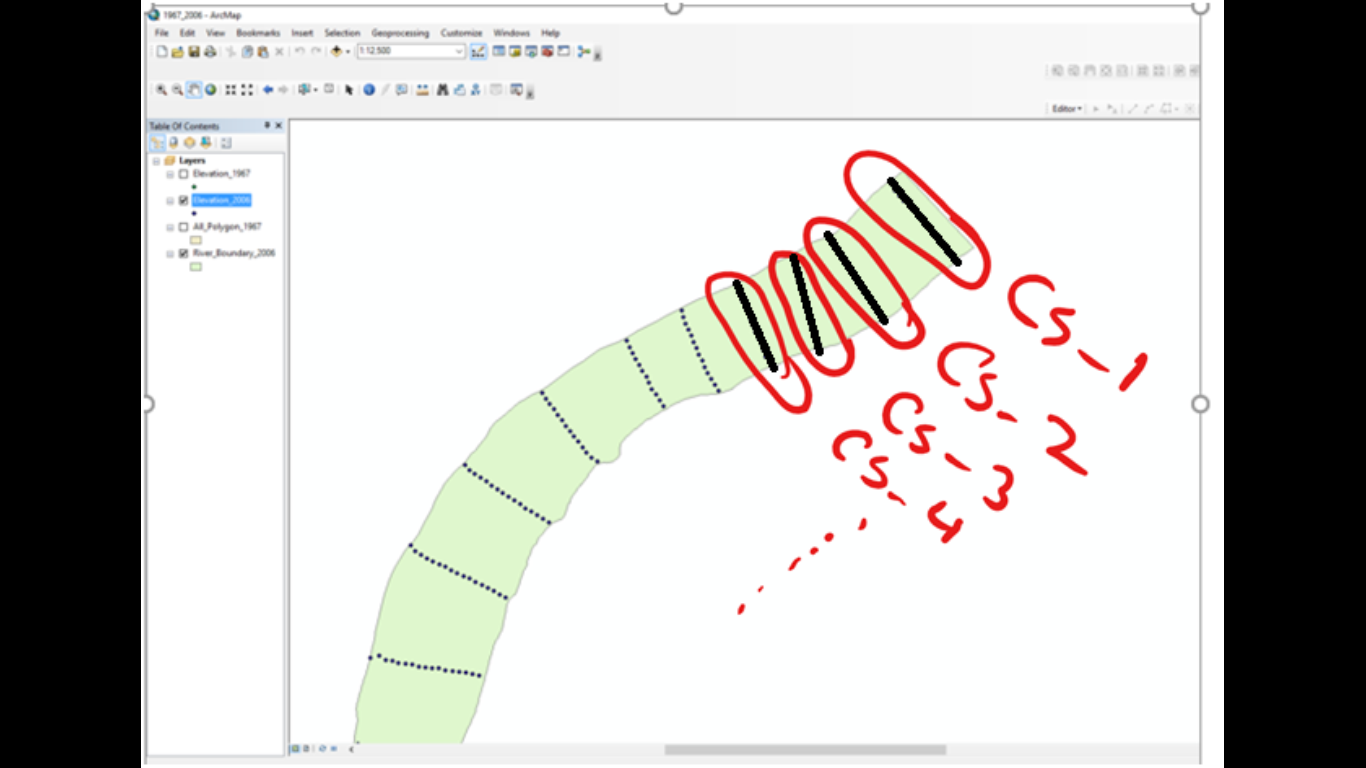
And join the like the below picture :
Thanks in Advance.
Solved! Go to Solution.
Accepted Solutions
- Mark as New
- Bookmark
- Subscribe
- Mute
- Subscribe to RSS Feed
- Permalink
I just played with just using the distance (not the direction) to define where to start a new line, and the results are not too bad I guess. See code below:
import arcpy
import os
arcpy.env.overwriteOutput = True
fc = r'C:\Esri\GeoNet\GIS_RIVER\23_elevation.shp'
fld_memo = 'TxtMemo'
fc_out = r'C:\Esri\GeoNet\GIS_RIVER\3D_lines_v06.shp'
fld_id = 'LineID'
fld_zmin = 'Z_min'
fld_zmax = 'Z_max'
id_format = 'CS-{}'
tolerance = 150
flds = ('OID@', 'SHAPE@', fld_memo)
lst_data = [[r[0], r[1], float(r[2])] for r in arcpy.da.SearchCursor(fc, flds)]
# create output featureclass
sr = arcpy.Describe(fc).spatialReference
ws, fc_name = os.path.split(fc_out)
arcpy.CreateFeatureclass_management(ws, fc_name, "POLYLINE", None, None, "ENABLED", sr)
arcpy.AddField_management(fc_out, fld_id, "TEXT", None, None, 25)
arcpy.AddField_management(fc_out, fld_zmin, "DOUBLE")
arcpy.AddField_management(fc_out, fld_zmax, "DOUBLE")
# insert cursor
flds = ('SHAPE@', fld_id, fld_zmin, fld_zmax)
cnt_id = 0
with arcpy.da.InsertCursor(fc_out, flds) as curs:
lst_lines = []
lst_pnts = []
for i in range(1, len(lst_data)):
print("i:{}".format(i))
lst_cur = lst_data[i]
lst_prev = lst_data[i-1]
pntg_cur = lst_cur[1]
pntg_prev = lst_prev[1]
dist = pntg_prev.distanceTo(pntg_cur)
if dist <= tolerance:
# add to existing list
pnt = pntg_cur.firstPoint
z = lst_cur[2]
pnt.Z = z
lst_pnts.append(pnt)
else:
print(" - create and store line and add point to new list...")
# create and store line and add point to new list
if len(lst_pnts) > 1:
polyline = arcpy.Polyline(arcpy.Array(lst_pnts), sr, True, False)
zmin = polyline.extent.ZMin
zmax = polyline.extent.ZMax
# lst_lines.append(polyline)
cnt_id += 1
line_id = id_format.format(cnt_id)
curs.insertRow((polyline, line_id, zmin, zmax, ))
else:
# not enough points to create line
pass
pnt = pntg_cur.firstPoint
z = lst_cur[2]
pnt.Z = z
lst_pnts = [pnt]The resulting 3D polylines also contain Z min and Z max values. The order of the ID's will follow the order of the points, not necessarily from the north to the south.
I will attach the resulting shape file for you to have a look and inspect if this comes anything near to what you are looking for.
- Mark as New
- Bookmark
- Subscribe
- Mute
- Subscribe to RSS Feed
- Permalink
You could... but how many do you have? 10's, 100's 1000's? and is this a one-off? because there are a variety of clustering point data and the spatial statistics toolset has some, but implementations in python/scipy/etc can be used as well depending on the complexity of the problem. I guess you would have to weigh the time to do this manually versus the time to implemented in an automated fashion.
- Mark as New
- Bookmark
- Subscribe
- Mute
- Subscribe to RSS Feed
- Permalink
May we assume that the points do not yet contain an identifier (like "CS-1")? does the process has to figure out which points to combine into a single line? If so, that would be the first challenge. The second challenge is to define in which order the points need to be connected. For the first challenge it would help to know what licence level of ArcMap or Pro you have (Advanced would allow the usage of tools like Near). Are you willing to share (a part of) your data?
- Mark as New
- Bookmark
- Subscribe
- Mute
- Subscribe to RSS Feed
- Permalink
Yes you're correct. How can I attach my data here? Couldn't find any option.
- Mark as New
- Bookmark
- Subscribe
- Mute
- Subscribe to RSS Feed
- Permalink
I've shared it. PFA.
- Mark as New
- Bookmark
- Subscribe
- Mute
- Subscribe to RSS Feed
- Permalink
I notice that the only attribute the points have, is a text field with a numeric value (probably depth).There is no "line identifier" and one should apply a distance calculation to define which points are to be combined into a line. In order to write a process that will create the lines, there are a number of challenges that you will face and some data quality issues that I noticed:
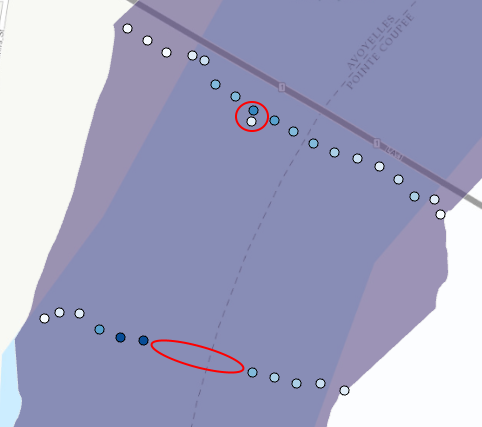
The red circle top center shows two points that have very different values. The white point probably has a wrong value. In the lower part the ellipse shows a larger distance (up to 150 meters) between the points that would probably need to be connected or are part of the same line.
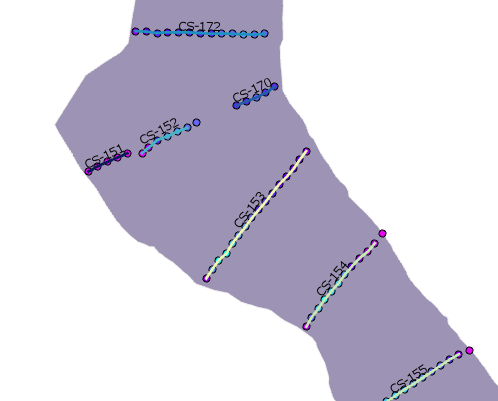
At the same time the profile lines sometimes are close together which will make it harder to distinguish the lines and assign points to the correct line.
... and in some case the lines cross:
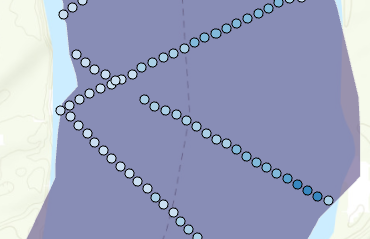
This will complicate the process.
Now the order of the points (FID) seems to follow the order in which the data was collected and that will help in defining the lines:
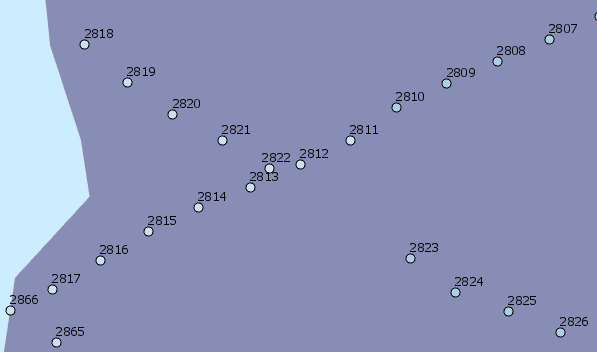
We can do something with direction and distance between consecutive points to define the lines.
- Mark as New
- Bookmark
- Subscribe
- Mute
- Subscribe to RSS Feed
- Permalink
Xander... keep on the inter-point direction idea, it should at least enable you to figure out the major groupings. For each grouping (maybe not all), a translation and rotation about the X or Y should facilitate point sorting, hence connection.
- Mark as New
- Bookmark
- Subscribe
- Mute
- Subscribe to RSS Feed
- Permalink
I just played with just using the distance (not the direction) to define where to start a new line, and the results are not too bad I guess. See code below:
import arcpy
import os
arcpy.env.overwriteOutput = True
fc = r'C:\Esri\GeoNet\GIS_RIVER\23_elevation.shp'
fld_memo = 'TxtMemo'
fc_out = r'C:\Esri\GeoNet\GIS_RIVER\3D_lines_v06.shp'
fld_id = 'LineID'
fld_zmin = 'Z_min'
fld_zmax = 'Z_max'
id_format = 'CS-{}'
tolerance = 150
flds = ('OID@', 'SHAPE@', fld_memo)
lst_data = [[r[0], r[1], float(r[2])] for r in arcpy.da.SearchCursor(fc, flds)]
# create output featureclass
sr = arcpy.Describe(fc).spatialReference
ws, fc_name = os.path.split(fc_out)
arcpy.CreateFeatureclass_management(ws, fc_name, "POLYLINE", None, None, "ENABLED", sr)
arcpy.AddField_management(fc_out, fld_id, "TEXT", None, None, 25)
arcpy.AddField_management(fc_out, fld_zmin, "DOUBLE")
arcpy.AddField_management(fc_out, fld_zmax, "DOUBLE")
# insert cursor
flds = ('SHAPE@', fld_id, fld_zmin, fld_zmax)
cnt_id = 0
with arcpy.da.InsertCursor(fc_out, flds) as curs:
lst_lines = []
lst_pnts = []
for i in range(1, len(lst_data)):
print("i:{}".format(i))
lst_cur = lst_data[i]
lst_prev = lst_data[i-1]
pntg_cur = lst_cur[1]
pntg_prev = lst_prev[1]
dist = pntg_prev.distanceTo(pntg_cur)
if dist <= tolerance:
# add to existing list
pnt = pntg_cur.firstPoint
z = lst_cur[2]
pnt.Z = z
lst_pnts.append(pnt)
else:
print(" - create and store line and add point to new list...")
# create and store line and add point to new list
if len(lst_pnts) > 1:
polyline = arcpy.Polyline(arcpy.Array(lst_pnts), sr, True, False)
zmin = polyline.extent.ZMin
zmax = polyline.extent.ZMax
# lst_lines.append(polyline)
cnt_id += 1
line_id = id_format.format(cnt_id)
curs.insertRow((polyline, line_id, zmin, zmax, ))
else:
# not enough points to create line
pass
pnt = pntg_cur.firstPoint
z = lst_cur[2]
pnt.Z = z
lst_pnts = [pnt]The resulting 3D polylines also contain Z min and Z max values. The order of the ID's will follow the order of the points, not necessarily from the north to the south.
I will attach the resulting shape file for you to have a look and inspect if this comes anything near to what you are looking for.
- Mark as New
- Bookmark
- Subscribe
- Mute
- Subscribe to RSS Feed
- Permalink
Good... got it..
For your first line... just want to confirm some results..
I just took the first line you produced in the array (a), did a sliding distance to confirm relative Interpoint spacing and determine the length.
The points are obviously are in order as expected, however, if they weren't but could be assumed to form a line, you can use the einsum distance calculation to calculate a rolling distance, then resort and reorder the input points.
The other simplest way is once the point array is pulled, you do a lexicographic sort, then do the rolling distance... same thing.
I will explore some more, but I like your approach to attain the groupings.
fc = r"c:\data\xander\3D_lines_v06.shp"
a = arcpy.da.FeatureClassToNumPyArray(fc, "*", explode_to_points=True)
a
Out[4]:
array([(0, [3149179.089548039, 915975.5614984678], 0, 'CS-1', -34.0, -11.0),
(0, [3149246.2167146187, 915900.8027559514], 0, 'CS-1', -34.0, -11.0),
(0, [3149309.089548039, 915823.5614984678], 0, 'CS-1', -34.0, -11.0),
...,
(317, [3161297.4812808945, 700683.7889148083], 0, 'CS-318', -75.0, 14.1),
(317, [3161211.598822891, 700631.6329313102], 0, 'CS-318', -75.0, 14.1),
(317, [3161127.88806113, 700576.5761440248], 0, 'CS-318', -75.0, 14.1)],
dtype=[('FID', '<i4'), ('Shape', '<f8', (2,)), ('Id', '<i4'), ('LineID', '<U25'),
('Z_min', '<f8'), ('Z_max', '<f8')])
a0 = a[a['LineID'] == 'CS-1']
xy = a0['Shape']
d = art.e_dist(xy[:-1], xy[1:])
print(d)
[[ 100.47 200.01 300.53 ..., 1099.95 1201.24 1299.93]
[ 0. 99.6 200.11 ..., 999.48 1100.77 1199.46]
[ 99.6 0. 101.27 ..., 899.98 1001.33 1099.95]
...,
[ 899.75 800.24 699.93 ..., 99.76 201.43 299.71]
[ 999.48 899.98 799.62 ..., 0. 101.85 200.01]
[ 1100.77 1001.33 900.81 ..., 101.85 0. 99.85]]
lgn = art.e_leng(xy)
lgn
Out[18]: 1304.1020133011878- Mark as New
- Bookmark
- Subscribe
- Mute
- Subscribe to RSS Feed
- Permalink
The logic I have used, will probably result in points that will not be included in any line and currently there is no mechanism included, to register those points to investigate what is going on for those cases. This logic could be included on line 59 to store those points in a separate featureclass for quality control.