- Home
- :
- All Communities
- :
- Developers
- :
- Python
- :
- Python Questions
- :
- Points to line in Arcmap
- Subscribe to RSS Feed
- Mark Topic as New
- Mark Topic as Read
- Float this Topic for Current User
- Bookmark
- Subscribe
- Mute
- Printer Friendly Page
- Mark as New
- Bookmark
- Subscribe
- Mute
- Subscribe to RSS Feed
- Permalink
Hi,
I have a set of points (as shown in the picture). I want to join them and assign unique id to them. How this can be achieved using python or Model Builder on Arcmap 10.5?
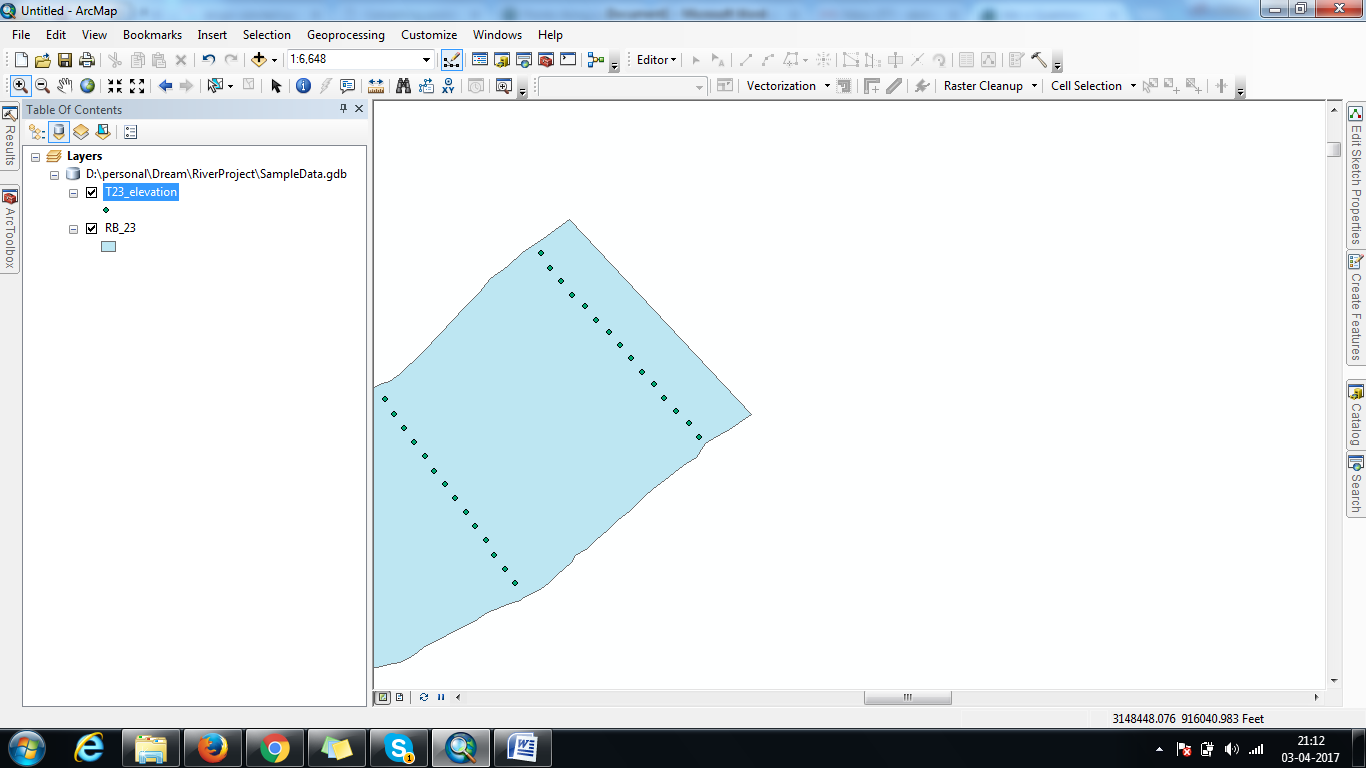
And join the like the below picture :
Thanks in Advance.
Solved! Go to Solution.
- Mark as New
- Bookmark
- Subscribe
- Mute
- Subscribe to RSS Feed
- Permalink
Xander... I have only begun looking at this, but since you mentioned that it appears that the points are in sequence, I exploded your polyline file to get at the points and then began to try to simplify the distance and angle calculations to see if that data could be readily used to find the break points in the dataset.
Here is some food for thought...
from numpy.linalg import norm
import numpy as np
fc = r"c:\data\xander\3D_lines_v06.shp"
a = arcpy.da.FeatureClassToNumPyArray(fc, "*", explode_to_points=True)
# just take the first 2 polylines as an example and get the xy coordinates
a0 = a[a['FID'] <= 1] # first two polylines
xy = a0['Shape'] # xy coordinates for above
# distance and its first order difference calculation
d = norm(xy[1:] - xy[:-1], axis=1)
d_diff = np.diff(d, n=1, axis=0)
# first order difference in coordinates for angle calculation
diff_1 = np.diff(xy, n=1, axis=0) # first order difference in coordinates
ang = np.arctan2(diff_1[:,1], diff_1[:,0])
dang = np.rad2deg(ang)The break points are readily detected, but the issue remains where lines cross or the end points are closer than the Interpoint spacing. The above could simplify the Interpoint distance calculations and offers the angle of incorporating angles in the analysis at the same time.
d # interpoint distances in a sequential point list ... note 3127.751 ...
array([ 100.474, 99.595, 101.273, 100.026, 101.059, 99.358, 100.664,
99.884, 99.705, 100.603, 99.765, 101.850, 99.847, 3127.751,
102.403, 100.232, 101.770, 99.748, 99.731, 100.276, 100.402,
99.814, 100.313, 100.225, 100.627, 103.806])
d_diff # interpoint first order difference ... note the break point
array([-0.878, 1.678, -1.247, 1.032, -1.701, 1.306, -0.780, -0.179, 0.899,
-0.838, 2.085, -2.003, 3027.905, -3025.348, -2.172, 1.539, -2.022,
-0.017, 0.545, 0.127, -0.588, 0.499, -0.089, 0.403, 3.179])
# the angle of point pairs in the sequence (degrees)... note the transition between
# the lines at -150
dang
array([-48.079, -50.855, -40.900, -52.817, -43.300, -49.899, -48.370, -52.989,
-45.406, -52.674, -47.031, -42.119, -56.951, -150.087, 126.719,
111.634, 105.997, 117.997, 111.050, 115.547, 109.158, 114.364,
110.313, 114.775, 104.025, 98.100])The interesting thing to note is that sometimes the distances can be used solely as in this example, but it would be possible to obtain two sets of points using the distance and the angles, using the transition pair (dist, angle) to split the pairs. Once the set is split, then you can pull out the coordinates and connect the lines.
I have tested some with randomized points from the data set and found that the triplet of (coordinates, Interpoint distance and angles) works pretty well to partition the data and form the lines. It worked better than kmean or kmean2 etc, Other options that I have looked at include the following and the are alright, except they fail when line spacing is in the same order as point spacing, or if lines cross or almost meet at their end.
(see other options
# from scipy.cluster.vq import kmeans2, kmeans, vq
# from scipy.cluster.hierarchy import dendrogram, linkage
# from scipy.cluster.hierarchy import fcluster )
We should probably branch this off as a discussion, but with your code replicated in that branch and the sample data
- Mark as New
- Bookmark
- Subscribe
- Mute
- Subscribe to RSS Feed
- Permalink
Hi Dan, That is indeed very cool. +1 for that! I just wished I had some more time available to really dig in...
- Mark as New
- Bookmark
- Subscribe
- Mute
- Subscribe to RSS Feed
- Permalink
Amazing. Would try this.
- Mark as New
- Bookmark
- Subscribe
- Mute
- Subscribe to RSS Feed
- Permalink
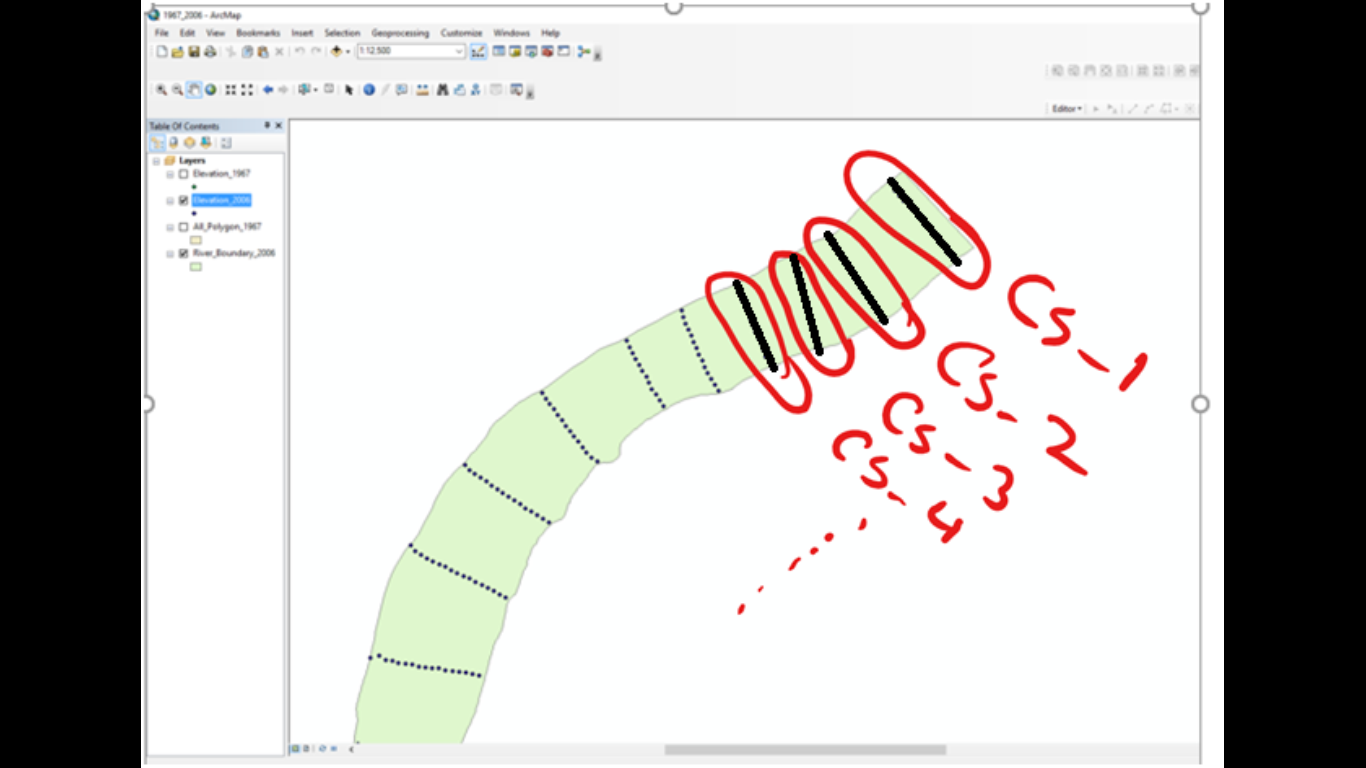
Hi, any idea on how I can join the last points to the polygon (So that it touches the river bank). Secondly now I've elevation point details and width of the cross section line, how can I calculate area under each cross section.
- Mark as New
- Bookmark
- Subscribe
- Mute
- Subscribe to RSS Feed
- Permalink
Xander,
Is there any possibilities that we can join all the point because some point are falling out of the line. It cause problem while extend the line up to River bank.
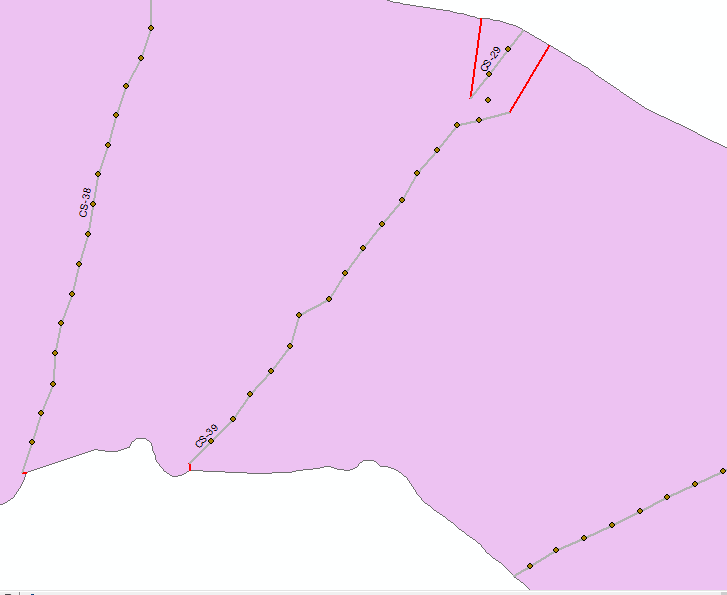
You can see the above example that when we extend the line feature its not touch the boundary of the river banks What I means that, Can we do like creating a line feature by nearest geometry instead of FID.
Thanks for help.
- Mark as New
- Bookmark
- Subscribe
- Mute
- Subscribe to RSS Feed
- Permalink
You're amazing. Thank you 
- Mark as New
- Bookmark
- Subscribe
- Mute
- Subscribe to RSS Feed
- Permalink
Sorry I didn't get it.
- Mark as New
- Bookmark
- Subscribe
- Mute
- Subscribe to RSS Feed
- Permalink
I 'd prefer to read this thread Create a line from points using attributes , I think you will get good answer.
- « Previous
-
- 1
- 2
- Next »
- « Previous
-
- 1
- 2
- Next »