Turn on suggestions
Auto-suggest helps you quickly narrow down your search results by suggesting possible matches as you type.
Cancel
- Home
- :
- About JeffreySwain

JeffreySwain
Esri Regular Contributor
since
07-01-2014


10 hours ago
816
Posts created
10
Kudos given
28
Solutions
68
Kudos received
Turn on suggestions
Auto-suggest helps you quickly narrow down your search results by suggesting possible matches as you type.
My Ideas
(2 Idea Submissions)Latest Contributions by JeffreySwain
|
POST
|
If you projected the file and then you saw that it failed to display, then ArcPad cannot fix that. If your uncompressed size of your .sid is 4.6 Gigs, than the projected Tif will be at least that size. Be sure that you have that much room to create a file like that and if you are using a network location, it will not time out. This time I would check the size of the file created and the display. If the output is bad again then could also be the version of ArcMap you are using. If you have ArcGIS 10, then I would think the Big Tiff, which I am not sure would display in ArcPad anyway. The best route may be to utilize a LizardTech license and then project it back to a sid in that software. ArcMap cannot export a sid to maintain the compression. I would also consider sticking with the coordinate system of the sids and move the vector data, since the exporting and projecting of the sids can create more problems. I have also been advised to check out the vector data and then add the sids in as an SD card, otherwise the apm will be huge and cause problems.
... View more
10-17-2012
05:35 AM
|
0
|
0
|
1249
|
|
POST
|
If you would like a more interactive display of the rows and columns, you can also use the Export Data Dialogue that will display the number or rows and columns as you modify the cell size or allow you to input them directly and see the cell size created. There is some art to this as simply modifying the one value may not create a raster that you want to use and in this case it may be desirable to Clip the raster down. Matthias ROCKS!!
... View more
10-17-2012
05:28 AM
|
0
|
0
|
1440
|
|
POST
|
[ATTACH=CONFIG]18466[/ATTACH] The GRID will look as the screenshot shows. To display it you have to add what is basically the folder in ArcMap/ArcCatalog. In Windows Explorer it looks like a folder and the other hidden folders are exposed. If you have something other than this then it seems as if you are missing data.
... View more
10-16-2012
01:04 PM
|
0
|
0
|
2639
|
|
POST
|
Did you restart ArcCatalog or just refresh the workspace? Since you said that the statistics did not appear it seems that they are still not appearing.
... View more
10-16-2012
12:58 PM
|
0
|
0
|
2633
|
|
POST
|
Will the raster display correctly in ArcMap when projected? Also is the 500 mb the size on disk or the uncompressed size? You file as a tif may be much larger than 500 mb. If it is a Big Tiff or larger than 4 Gigs on disk then I do not think that ArcPad will recognize it. For more immediate help, I would also recommend creating an incident with Esri Support rather than a random forum post. ArcPad Raster Information
... View more
10-16-2012
12:47 PM
|
0
|
0
|
1249
|
|
POST
|
Sarah, I am glad to see that the recommendation to uninstall the other version of python and then repair ArcMap worked to get the process working again. Thanks for calling Esri Support.
... View more
10-15-2012
08:35 AM
|
0
|
0
|
4953
|
|
POST
|
If you are using version 10 or higher, you can also create the NDVI output with the mosaic dataset as well.
... View more
10-11-2012
05:23 AM
|
0
|
0
|
3815
|
|
POST
|
What raster format are you outputting to? Have you tried .tif or .img? If you are outputting to an Esri GRID, I have seen this issue, but never been able to reproduce it in house. The floating profiles in academic institutions seem to be part of the issue, I would also recommend trying to move the working directory to a local location as well for the processing. I also assume that you have made the necessary changes in the syntax for Raster Calculator to work.
... View more
10-11-2012
05:18 AM
|
0
|
0
|
3761
|
|
POST
|
You have a lot going on in that statement. I am not sure what you mean by 100 meter spacing? Do you mean 100 meter interval? Contours are usually reported in terms of intervals not spacing. Spline is fine for rubbersheeting as some of the other interpolations have other algorithms to balance it, but if you are looking for the interpolation to match the point value at the point then spline works fine. [ATTACH=CONFIG]18360[/ATTACH] There is a older document that discusses the way the interpolations look at the values in the point that helps that I am attaching as well as the document that discusses it from ArcNews. So once you have the raster you should be able to generate the contours at a 100 meter interval to get the desired results.
... View more
10-11-2012
05:13 AM
|
0
|
0
|
1895
|
|
POST
|
You show the coordinate system for the layers, but not the scenes. In general, it has been the opposite that I have seen with regards to video cards. The Nvidia cards seem to not have issues, where as some of the AMD/ATI cards do. I would be curious to see if you have any vertical exaggeration set and what the coordinate system of each scene is. The coordinate system of your layer is meters based, so your coordinate system should be as well.
... View more
10-11-2012
04:14 AM
|
0
|
0
|
3910
|
|
POST
|
You can create the lines at the desired intervals, interpolate them to 3d and then use the profile graph to create the cross sections.
... View more
10-11-2012
04:06 AM
|
0
|
0
|
1136
|
|
POST
|
When you are running the tool, are you running it from ArcMap, ArcCatalog, or python? I would think that if you can see the file in ArcMap and select it from the dropdown then it would work. Also if you can path to it, then it should work as well. The confusing part in your statement was that you said lidar points was the name you gave it to output to, it looks as if it is looking for that as the las file, since it says table. Have you tried to run it with a different name? What version is your geodatabase? Have you tried a shapefile output? Since you are using multipoint, you may decide to put it in a new feature dataset if you are looking to create a terrain. The only other way I have seen a similar error is when the information in the las file will not fit in the coordinate system chosen.
... View more
10-11-2012
03:32 AM
|
0
|
0
|
1759
|
|
BLOG
|
Suppose you have a 3D polygon and would like to determine whether 3D points are above versus below the surface of the polygon. Near 3D is a logical geoprocessing tool to determine which points are above and which are below, right? 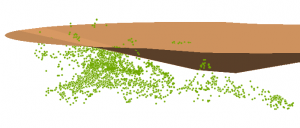 3D Points with 3D Polygon In this particular case, the answer is no. The results from the Delta Z created in the Near 3D analysis cannot be used because the geometry of the polygon is only maintained at the edge of the polygon. Therefore, the results will be based on the distance from the point to the edge of the polygon, not the distance from the point to the polygon surface directly above or below the point. 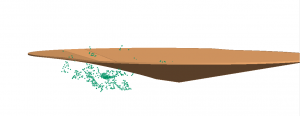 Points considered negative when only considering the Delta near Z To determine whether the point is above and below the polygon surface, follow this workflow instead. 1. Convert the 3d Polygon to a TIN via the Create TIN tool. 2. Use the Add Surface Information tool to add the TIN values to the point. 3. Use the Add XY Coordinate tool if you do not have z-values for your 3D point data. 4. Add a field to calculate the difference. 5. Subtract the field with the TIN Elevation from the z-value of the point. 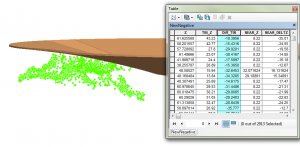 Correct output with the field showing the difference field With this workflow, if the result is positive, the point is above the surface. So, when using the new 3D Analysis toolsets, be sure to consider the geometry of the features being used. ReferencesEditing polygons in 3DJeff S. -- Raster Support Analyst |