- Home
- :
- All Communities
- :
- Events
- :
- User Conference
- :
- User Conference Blog
- :
- Live Blog: 2017 Esri UC Plenary (Afternoon Session...
Live Blog: 2017 Esri UC Plenary (Afternoon Session)
- Subscribe to RSS Feed
- Mark as New
- Mark as Read
- Bookmark
- Subscribe
- Printer Friendly Page
- Report Inappropriate Content
We hope you've enjoyed following along the Morning Plenary Session Live Blog. Now, Matt Ball and I will take you through the Afternoon Session starting at 2pm and we look forward to seeing your feedback and contributions in the comments below!
Update: Check out each UC 2017 day recap:
- Live Blog: 2017 Esri UC Plenary (Morning Session)
- UC 2017 Daily Updates Day Two (Tuesday/Monday)
- UC 2017 Daily Updates Day Three (Wednesday)
- UC 2017 Daily Updates Day Four (Thursday)
- UC 2017 Daily Updates Day Five (Friday): Closing Session and Awards
Plenary Segments (click to jump to segments)
- 2:00 - UnderstandingUnderstanding
- 2:12 -Science and 25 Years of Education Applying The Science of Where
- 2:25 - 4H Class is in Session: Exploring Obesity and the Impact of Southern Cooking
- 2:45 - Building Zootopia with aUnified Multilayer Map
- 3:05 - Making a Smarter Dubai
- 4:00 -The Science of Where, When and How with Dr. Geoffrey West
12:40 - Check out the UC 2017 Big Ideas Poster, Plenary Music Playlist
As we get ready for the Afternoon Session, we invite you to check out these two documents for additional info on what you saw and heard during the plenary. Enjoy!
2:00 - UnderstandingUnderstanding
And, we're back! We hope you enjoyed the break and are ready to dive into the afternoon session.
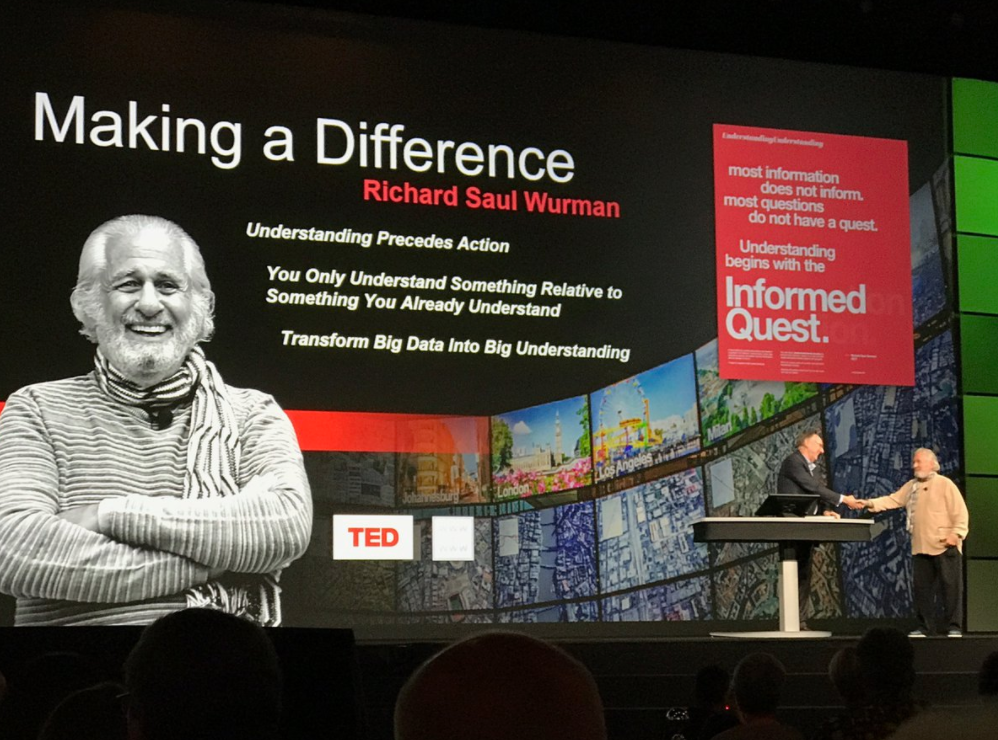
Jack welcomes Richard Saul Wurman, the prolific author, TED conference creator, and a longtime collaborator with Esri, to the stage to accept the Making a Difference Award at the 2017 Esri User Conference. Wurman has a passion for making difficult information easy to understand, and he has turned to GIS to help improve understanding on multiple projects.
He engaged with GIS technology on the Urban Observatory project, an interactive exhibit to compare and contrast maps of cities around the world. The app pulls live data and allows you to compare disparate cities side by side to get a comparative understanding of the makeup of cities.
Each of his 90 books springs from Wurman’s interest in understanding. His curiosity drives his inquiries, and he seeks to make the complex clear. He’s written a number of books with understanding in the title, including Understanding USA (1999), Understanding Children (2002), and Understanding Healthcare (2004).
His latest book, UnderstandingUnderstanding, explores design by compiling many paths of understanding that lead to creation.
2:12 - Science and 25 Years of Education Applying The Science of Where

Dawn Wright, Esri’s chief scientist introduces the Education (Education) segment of the program by first declaring, “I think we can all agree that education is the key to a brighter future.” She relates that education provides opportunities for all ages to shine.
Personal and professional development are enhanced from thinking spatially, which is one of the most powerful ways to make sense of the world. The new science of neurogeography examines how people are able to reason spatially. It’s looking at higher-order cognitive processes to discern geographic patterns and make important decisions at geographic scale. Neurogeographers are constantly scanning brains as their research subjects look at maps. Spatial thinking is a rich area that needs further understanding to show how spatial thinking impacts other mental activities.
This “brave new Digital Earth” demands that we rethink the role of education in our lives. Learning can become an entire way of life, rather than just a prelude to adulthood.
Wright encourages us all to engage in and pursue lifelong learning
- Through a free Massive Open Online Cource (MOOC) that Esri offers as 4-6 week-long courses, with a new Cartography course coming in November
- Learn.ArcGIS.com offers dozens of shorter hands-on learning activities
- The ArcGIS Book contains great content to spur learning
In higher education, the best approaches for STEM involve project-based learning. New digital curricula are pushing more engagement with digital textbooks students carry along on their phones. Jupyter Python notebooks, powered by the ArcGIS API for Python (ArcGIS API for Python), allow students to explore and experiment and innovate with live code and visualizations. This is expanding GIS into new fields.
Wright encourages Esri users to share data with a college or university, consider using ArcGIS Open Data and ArcGIS Hub to empower open science. Ecological Marine Units (EMU) are a 3D map data from the ocean surface down to the ocean floor that are inspiring educators. She asks users to introduce an educator to more than 100 Esri crafted GeoInquiries that provide focused activities with pre-built maps on ArcGIS Online. She also suggests that users become GeoMentors to coach others on the use of GIS.
Learning is a lifelong voyage of discovery – and you can learn by passing on your learning.
2:25 - 4H Class is in Session: Exploring Obesity and the Impact of Southern Cooking
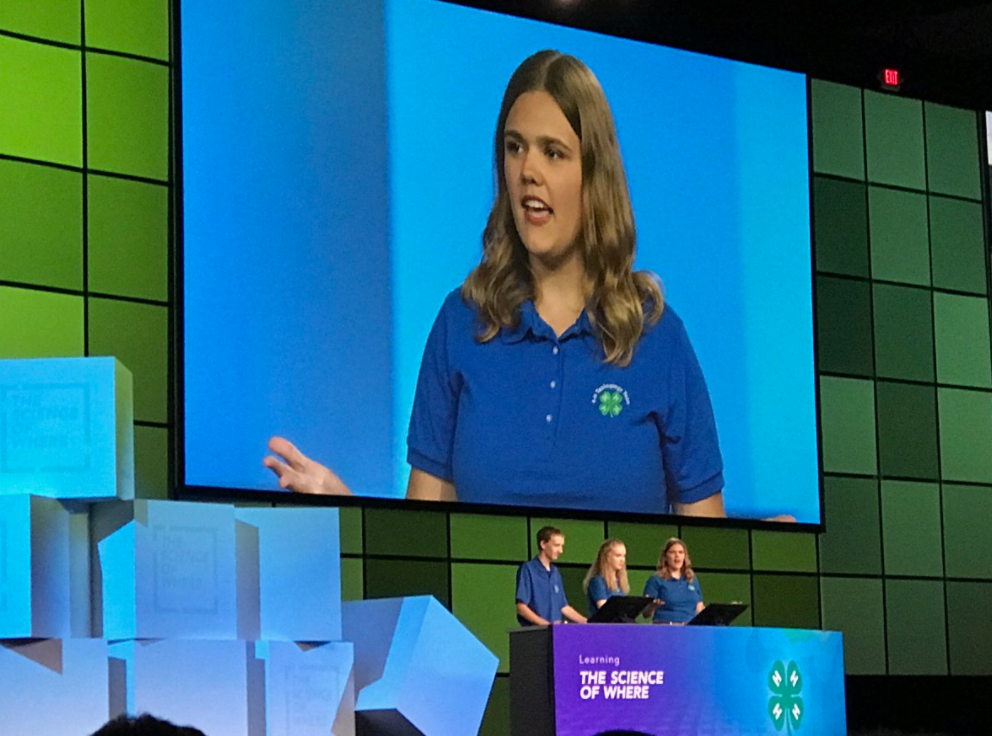
Dawn Wright introduces the team of 4H students. "We have three outstanding young scientists from the 4-H GIS program all the way from Tennessee: Austin Ramsey, Elizabeth Sutphin and Amanda Huggins. The students took a close look at the health in their county. They focused in on obesity, lack of exercise facilities, food security, and diabetes incidents."
They worked to map health across the United States. They did analysis on adult obesity across the country. They showed high obesity in the Southeast, and low obesity out West. They used the Optimized Hot Spot Analysis tool to see counties with low obesity that have counties with high obesity rates around them. They used the swipe tool to drag across the data to show the hot spots and dive into the data.
The charts feature was used to drill down into the data. Using the Definition Query they zoomed into Tennessee to see the obesity rates in their county.
Next, they picked child poverty, diabetes food insecurity and lack of exercise to compare to the obesity map. It returned box plots with mean lines that show the range in the dataset. There were some strong correlations between these four factors and obesity. It also raised a question about why the rates are high in some areas and low in others – something they’re still exploring.
When Jack asked why, the answer -- "It could be our Southern cooking."
Next, they created a Web App to share the information with the 4-H clubs across the US.
2:45 - Building Zootopia with a Unified Multilayer Map
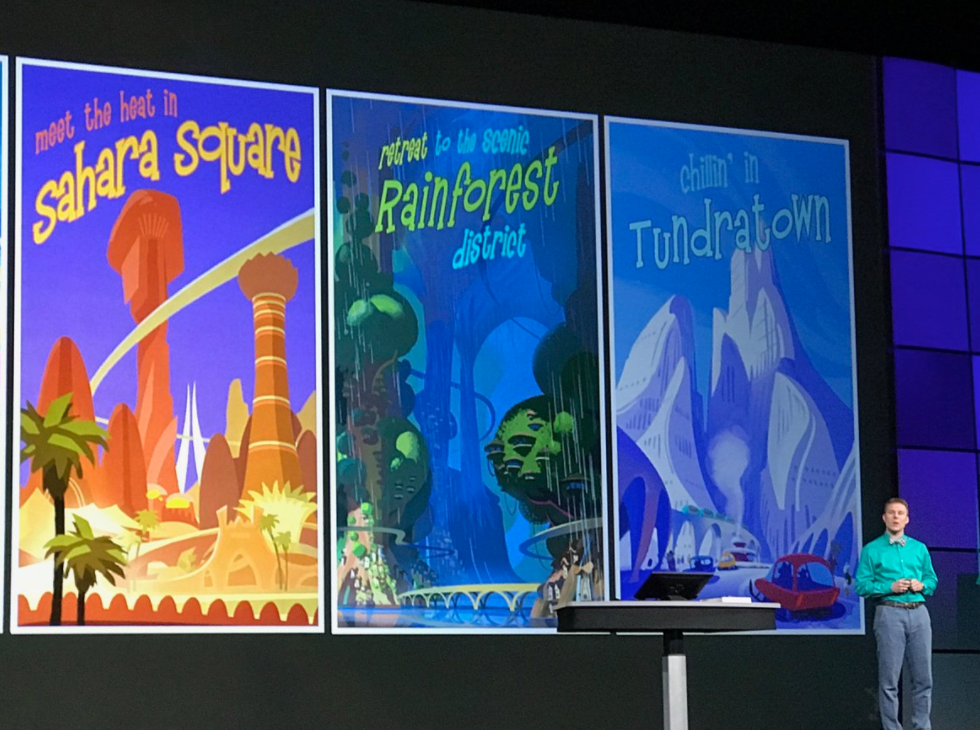
Walt Disney Animation Studios has a stellar reputation for creating compelling stories, believable worlds, and appealing characters since its inception. It all started in 1937 with the first fully animated feature film, Snow White and the Seven Dwarfs, and the company has continued their masterful storytelling, beautiful artistry, and pioneering approach through the use of ground-breaking technology ever since.
Brandon Jarratt, General Technical Director at Walt Disney Animation Studios took to the stage to show how they used Esri’s CityEngine (CityEngine) procedural modeling software to create a believable world for the Academy award-winning film Zootopia, which won the Oscar for Best Animated Feature this year.
The film was directed by Byron Howard, co-directed by Rich Moore, and produced by Clark Spencer. The pitch for the move was a new take where animals act like humans in an animal world where humans haven’t existed.
“A city full of talking animals wearing clothes and using mobile phones is not exactly realistic – but ‘believable’ in that you believe the characters would actually inhabit that place,” says Jarrett.
In Zootopia, animals have evolved with predators and prey living together in harmony. This includes 70 species of animal from giraffes down to shrews. The goal was to create the geography, scale and style to complement and support the story. The effort incorporated elements of geodesign with an understanding of what the animals needed and creating a world that was livable for all.
The Walt Disney Animation Studios previously used Esri’s CityEngine during the production of Big Hero 6 to build the city of San Fransokyo. It helped achieve the scale and visual complexity based on the actual geography of San Francisco with Japanese-inspired architecture on top.
In Zootopia, the architecture was driven by the natural world with the thought that animals would prefer a more organic design. The designers started with giant rocks in China that look like skyscrapers and the organic architecture of Gaudi as examples.
The designers wanted to play with scales to have a city where a mouse and an elephant would interact in the scale appropriate to animals of all sizes, with big and tiny doors, and vehicles and streets of all sizes. The next driving thought was a city that was quartered for the different climates that animals inhabit.
The city started with an overall map and separate maps for each of the climate districts. Using procedural rules with shapes and textures unique for each district, and a library of buildings, dragging sliders achieved believable scale zoomed in and out to see the overall density and complexity.
A unified multilayer map helped drive the design thinking. In the Sahara district, they looked for a blockier honeycomb shape for the hot climate. They used carefully calibrated distribution rules to replicate the buildings across the landscape automatically. A street-level test render of Sahara Square was shown with building and color differentiation that looks believable. It’s made up of 61,000 parts.
The downtown core with buildings that grow taller as they climb the central hill, were easily rendered in CityEngine using a ramping silhouette. They first used procedural rules to generate some test plots, and iterated with feedback from art directors to reach something they were happy with.
Each district has thousands of parts, and overall there are more than 300,000 parts. The presentation ended with a video of the train ride sequence that demonstrates the results that were achieved across each district and the city as a whole.
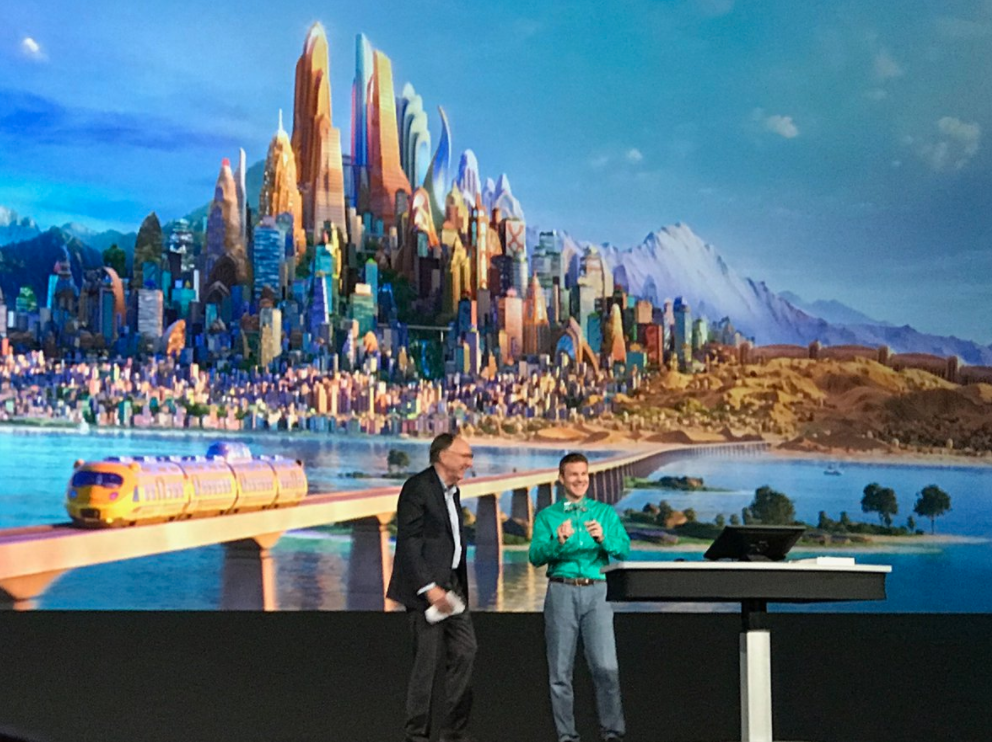
Jack gave Brandon and his team the "Best Animated Feature Using GIS" award. Like it was Oscar night (before the "get off the stage"orchestra music started playing), Brandon quickly ran through his long list of thank you's giving a shout out to all his collaborators and, of course, his wife sitting in the front row.
3:05 - Making a Smarter Dubai

H.E. Dr. Aisha Bint Butti Bin Bishr, Director General of the Smart Dubai Office, runs the Smart Dubai program. Their goal is to make the happiest city on the Earth with technologies that help transform, including technologies that make us closer to our friends and family.
Technologies that make the city safer and more seamless also make it happier. The inspiration of the transformation started in 1999 with an ICT strategy. The Smart Dubai initiative began in 2015.
The challenge was to unify the efforts underway in the public and private sector with a smart transformation. Data is at the heart of the city transformation. As the open data and insights initiative took hold, it’s increased the impact to the economy.
Geospatial technologies for maps and wayfinding are an important factor. The city has signed a citywide agreement to create a city cloud platform not only with the government but with the private sector.
Kaveh Vessali showed the Dubai Pulse, which allows everyone to learn more about places, events and project in real time. Distributed GIS is being used to improve mobility in a city that has tripled in the last 25 years. Anyone can take the pulse of project in planning, design or recently completed. Details of the project can be seen, including feedback from social media. Feedback helps to measure happiness.
Evidence-based decision making, with anonymized mobile phone data, allows the city to see the commute patterns of citizens. The city is a linear city, and it can take more than an hour to get from one end of the city to the other. Addressing road safety is a key initiative.
Hossam Sayed shared the Shams Dubai Calculator app that calculates the energy generated from solar power, allowing citizens to decide whether solar panels are a good investment. Smart environment requires smart infrastructure.
Hanan Huwair Al Zarooni demonstrated the D3 Dashboard for the Dubai Design District. There is a strong control system and property system, drilling down to the building view to understand space allocation and to show off real estate to potential tenants. They can look at the energy usage in the buildings with a command and control center to look at the status and analyze trends.
The next fifty years will continue the transformation. The city is implementing block chain to deliver trusted services, with plans to go paperless by 2021, to add 25% autonomous vehicles by 2030, and by 2050 to export its last drop of oil.
Smart Dubai is laying the foundation, and the first goal is to make the city the happiest on the Earth.
4:00 - The Science of Where, When and How with Dr. Geoffrey West
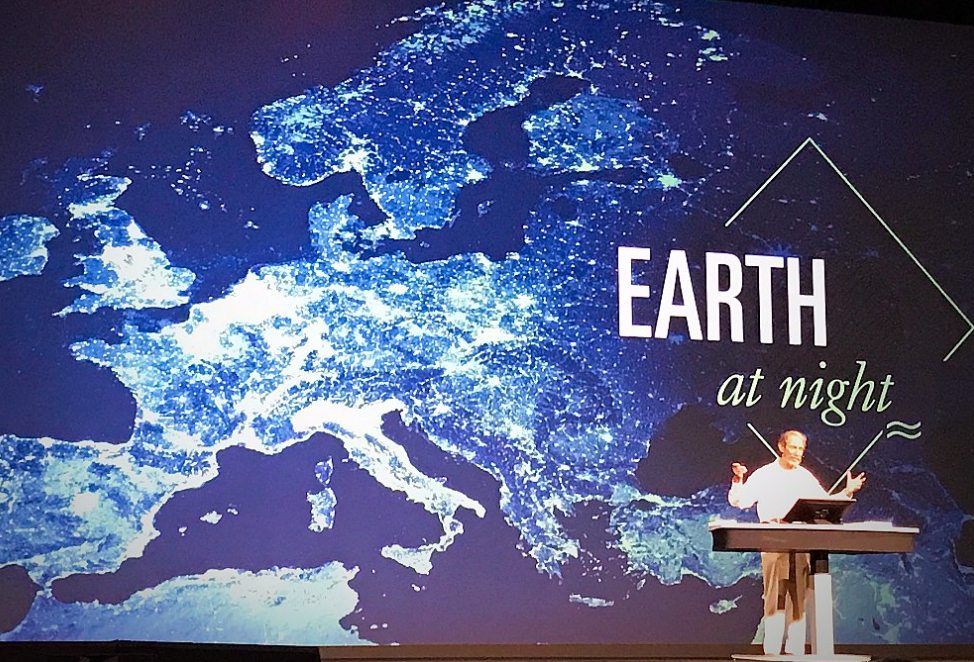
Dr. Geoffrey B. West, distinguished professor and former president of the Santa Fe Institute is a theoretical physicist whose primary interests have been in fundamental questions in physics, especially those concerning the elementary particles, their interactions, and cosmological implications.
His long-term fascination in general scaling phenomena evolved into a collaboration on the origin of universal scaling laws in biology from the molecular genomic scale up through mitochondria and cells to whole organisms and ecosystems. This led to the development of realistic quantitative models for the structural and functional design of organisms based on underlying universal principles.
West has received much attention in both the scientific and popular press for the framework for quantitative understanding of problems. His current interest is the extension of these ideas to understand quantitatively the structure and dynamics of social organizations, such as cities and corporations, including the relationships between economies of scale, growth, innovation and wealth creation and their implications for long-term survivability and sustainability.
His book, “Scale –The Universal Laws of Growth, Innovation, Sustainability, and the Pace of Life in Organisms, ...” explores these issues and forms the basis for his keynote address at the 2017 Esri International User Conference.
With growing populations, and increased urbanization, we need to add a city the size of San Diego each week. The growing urbanization, and the fate of humans on the planet, is bound up in the success of our cities.
When we think of cities, we think in terms of their physicality, the buildings and the boulevards. The most critical part of cities are the people, bringing people together, and facilitating interactions. They facilitate idea creation, wealth creation, and innovation.
The city can be thought about in terms of energy and infrastructure as well as exchange of information. Cities and urbanization are the problem in terms of pollution and environmental impact, but they are also the solution.
There’s an urgent need for an underlying science for cities. We tend to box this inquiry into health, economy, resources, energy, food, transportation, social, political, ecology, environment, and climate issues. For a deeper understanding, we need to think in integrated systems terms.
The laws of cities are not independent – they are all highly coupled, inter-related, and at multiple scales. They are complex adaptive systems that need understanding.
Metabolic rate of animals has an extraordinary systematic economy of scale. Slope exponents are typically sub-linear and simple multiples of ¼. All the animals that look so different are scaled versions of each other. It’s true of plants, birds, fish, and more. The underlying principles of networks drive this issue of scaling, and you can create mathematical formulas for all of these scales.
With cities, as you double them, you get a 15% savings on the infrastructure. Meaning that if you double their size, you just need 85% more roads, water lines, electric lines, etc. to serve the larger size. You also increase the socio-economic benefits.
These patterns happen throughout the world and without interaction. These scales are universal, and it’s just the universality of our social interaction networks, with a hierarchy of groups, that drives it all. We have a positive feedback mechanism for how we speak to each other, interact and share ideas.
The motion of everyone can also be mathematized, giving you the ability to predict movement in a city. All journeys are willful, from home to work and back, and so forth. The flux and pattern can be predicted.
Life also speeds up in a predictable linear way, such as an increase of walking speed as cities get larger. As speed and growth increase, it reaches super-exponential growth as it nears the singularity. Major innovations are the way to avoid collapse, however, we need to continue to innovate at a faster and faster pace.
What we have to do is redefine the idea of growth – not just economic, but in terms of quality of life. We also need to rethink innovation and paradigm shifts.
A revolution in social and cultural terms may get us out of this. We need to revolutionize our cultural values in order to reframe our fate. As we add more people, we cannot continue to consume the amounts of energy we are consuming.
And that's a wrap! Thanks for following along today and stay tuned for updates during the week in the User Conference group. If you missed any of the morning plenary session check it out here. And be sure to check out these tools too:
You must be a registered user to add a comment. If you've already registered, sign in. Otherwise, register and sign in.