- Home
- :
- All Communities
- :
- Industries
- :
- Transportation
- :
- Transportation Questions
- :
- Calculated locations differ from plotted locations
- Subscribe to RSS Feed
- Mark Topic as New
- Mark Topic as Read
- Float this Topic for Current User
- Bookmark
- Subscribe
- Mute
- Printer Friendly Page
Calculated locations differ from plotted locations
- Mark as New
- Bookmark
- Subscribe
- Mute
- Subscribe to RSS Feed
- Permalink
Hello
Please accept my apologies in advance if this proves to be the result of an elementary mistake.
I have a set of observations made from given points. For each of these I have an observer location (coordinates) and a distance (metres) and bearing (degrees) to an observation target. I want to determine the perpendicular distance of this observation target from a specific route(line). When mapped (Projected Coordinate System = British National Grid) the perpendicular distances produced (identified using 'Generate Near Table' and checked roughly using the measurement tool) differ markedly (10-40%), and inconsistently, from those obtained if I calculate the distance from the original data using simple trigonometry. Given that the units of the coordinate system are metres and the distances are not geographically large (generally <500m), I'm struggling to understand why this should be. What am I missing?
The attached document perhaps gives a clearer explanation.
- Mark as New
- Bookmark
- Subscribe
- Mute
- Subscribe to RSS Feed
- Permalink
Edit:
The calculated v mapped values are D - 103.6m v 76.9m and E - 67m v 64.7m
- Mark as New
- Bookmark
- Subscribe
- Mute
- Subscribe to RSS Feed
- Permalink
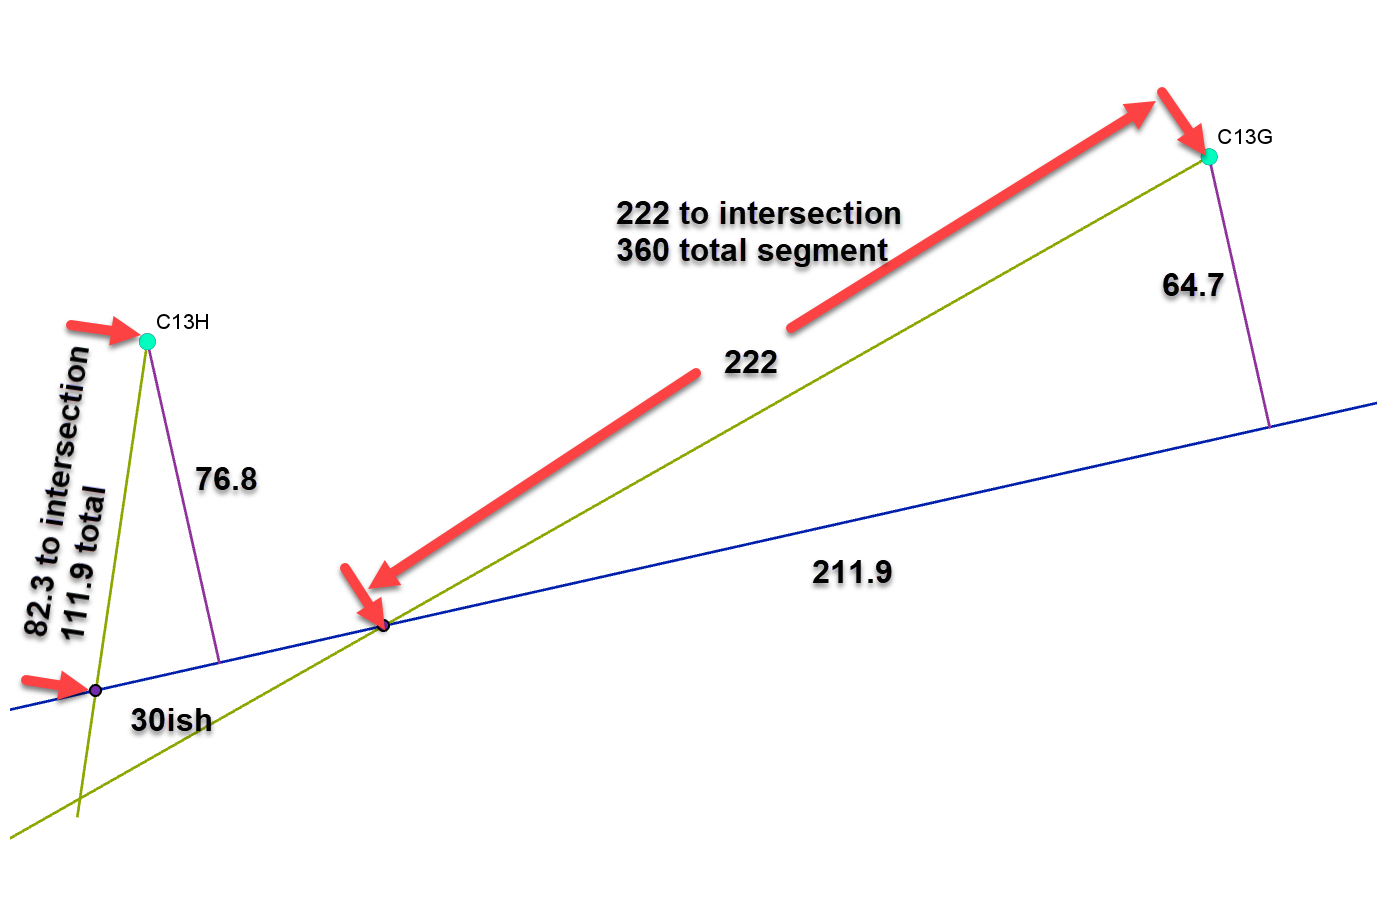
everything is relative to that blue baseline
here are some manual measurements off the file.
If the blue line is wrong, then the angles are wrong and the hypotenuse is wrong.
That is one of the problems with one length-one angle calculations.
All triangles were formed from the blue line, the intersection points of blue/green and the observation points C13G and C13H
- Mark as New
- Bookmark
- Subscribe
- Mute
- Subscribe to RSS Feed
- Permalink
In order for those figures to work using trigonometry i.e. for point C13G, Adjacent = 211.9m, Opposite = 64.7m, Hypotenuse = 222m, ϴ (the angle at the intersect between blue/green lines) has to be 24.35o (since ϴ = cos-1 (adjacent2/hypotenuse2)).
But, because of their relative locations, ϴ must be the same as (Transect Bearing - Observation Bearing), yet this = 82.4 o – 61o = 21.4 o!
Similarly, for the figures to work for C13H, ϴ has to be 82.58o but it should be 73.4o based on the transect route and bearing to the observation (82.4o – 9o).
I understand what you are saying re. the potential for the blue (transect) line being wrong but, given that it was plotted in ArcMap from lat/lon points (with the bearing determined by Arc), and the points being determined by Arc from empirical distance and bearing measurements, I don’t see where the error can be.
- Mark as New
- Bookmark
- Subscribe
- Mute
- Subscribe to RSS Feed
- Permalink
blue line... 21.4 degrees relative to x-axis (?!?)... I will check when I get a chance.
- Mark as New
- Bookmark
- Subscribe
- Mute
- Subscribe to RSS Feed
- Permalink
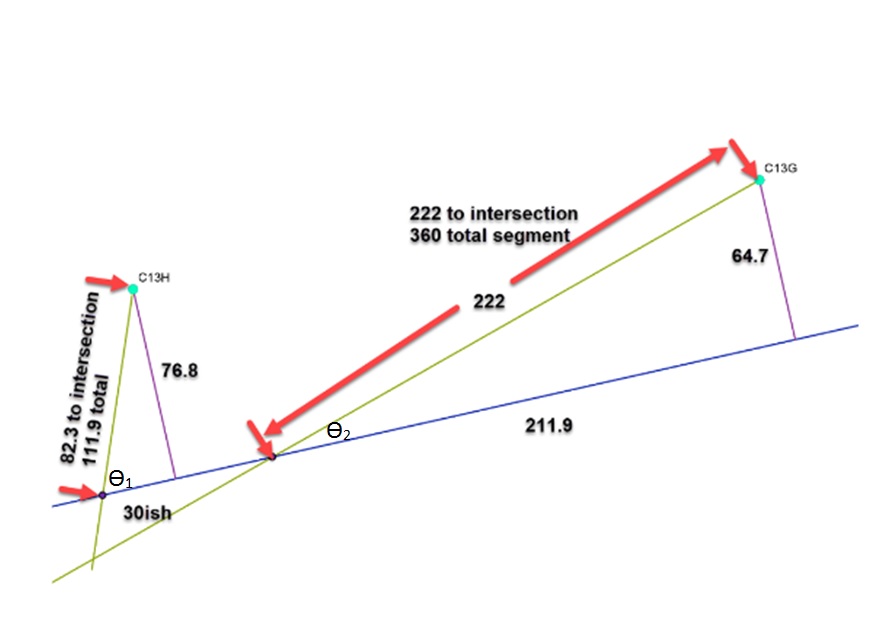
No...treating these as trig problems, the internal angles of the triangles formed by the intersection of the green and blue lines (see below - ϴ1 & ϴ2).
- Mark as New
- Bookmark
- Subscribe
- Mute
- Subscribe to RSS Feed
- Permalink
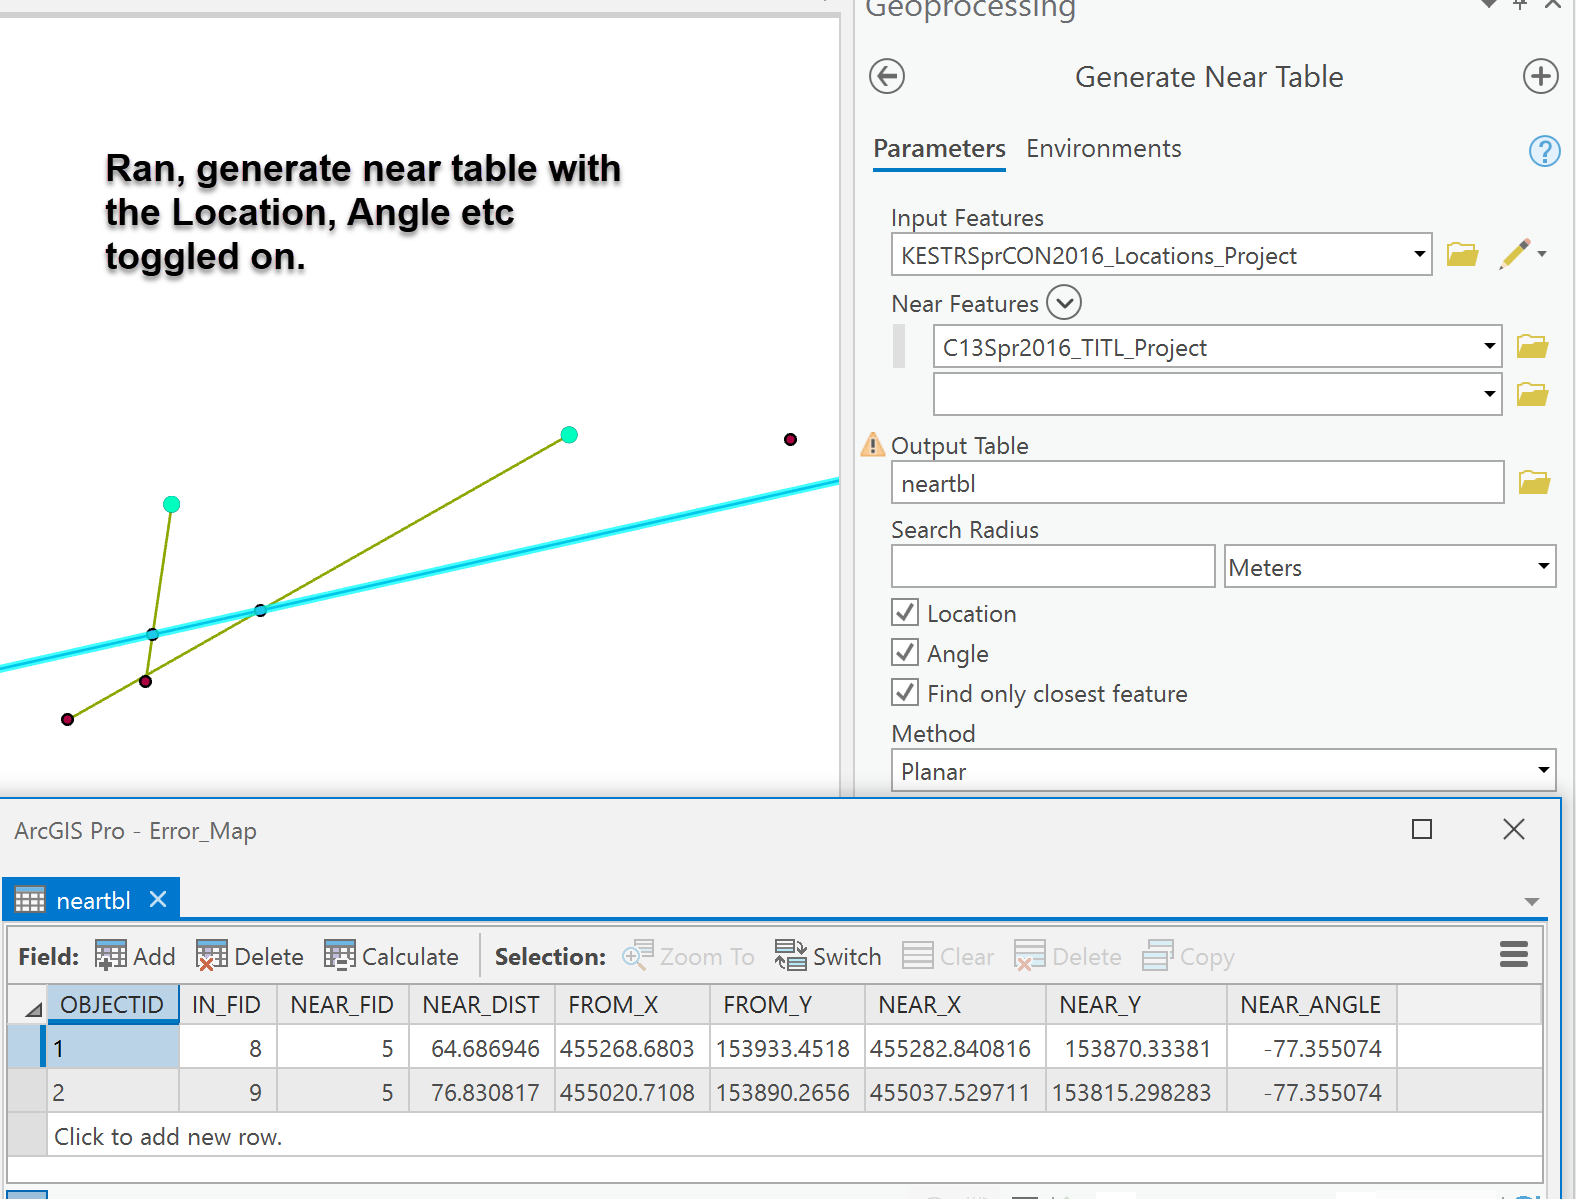
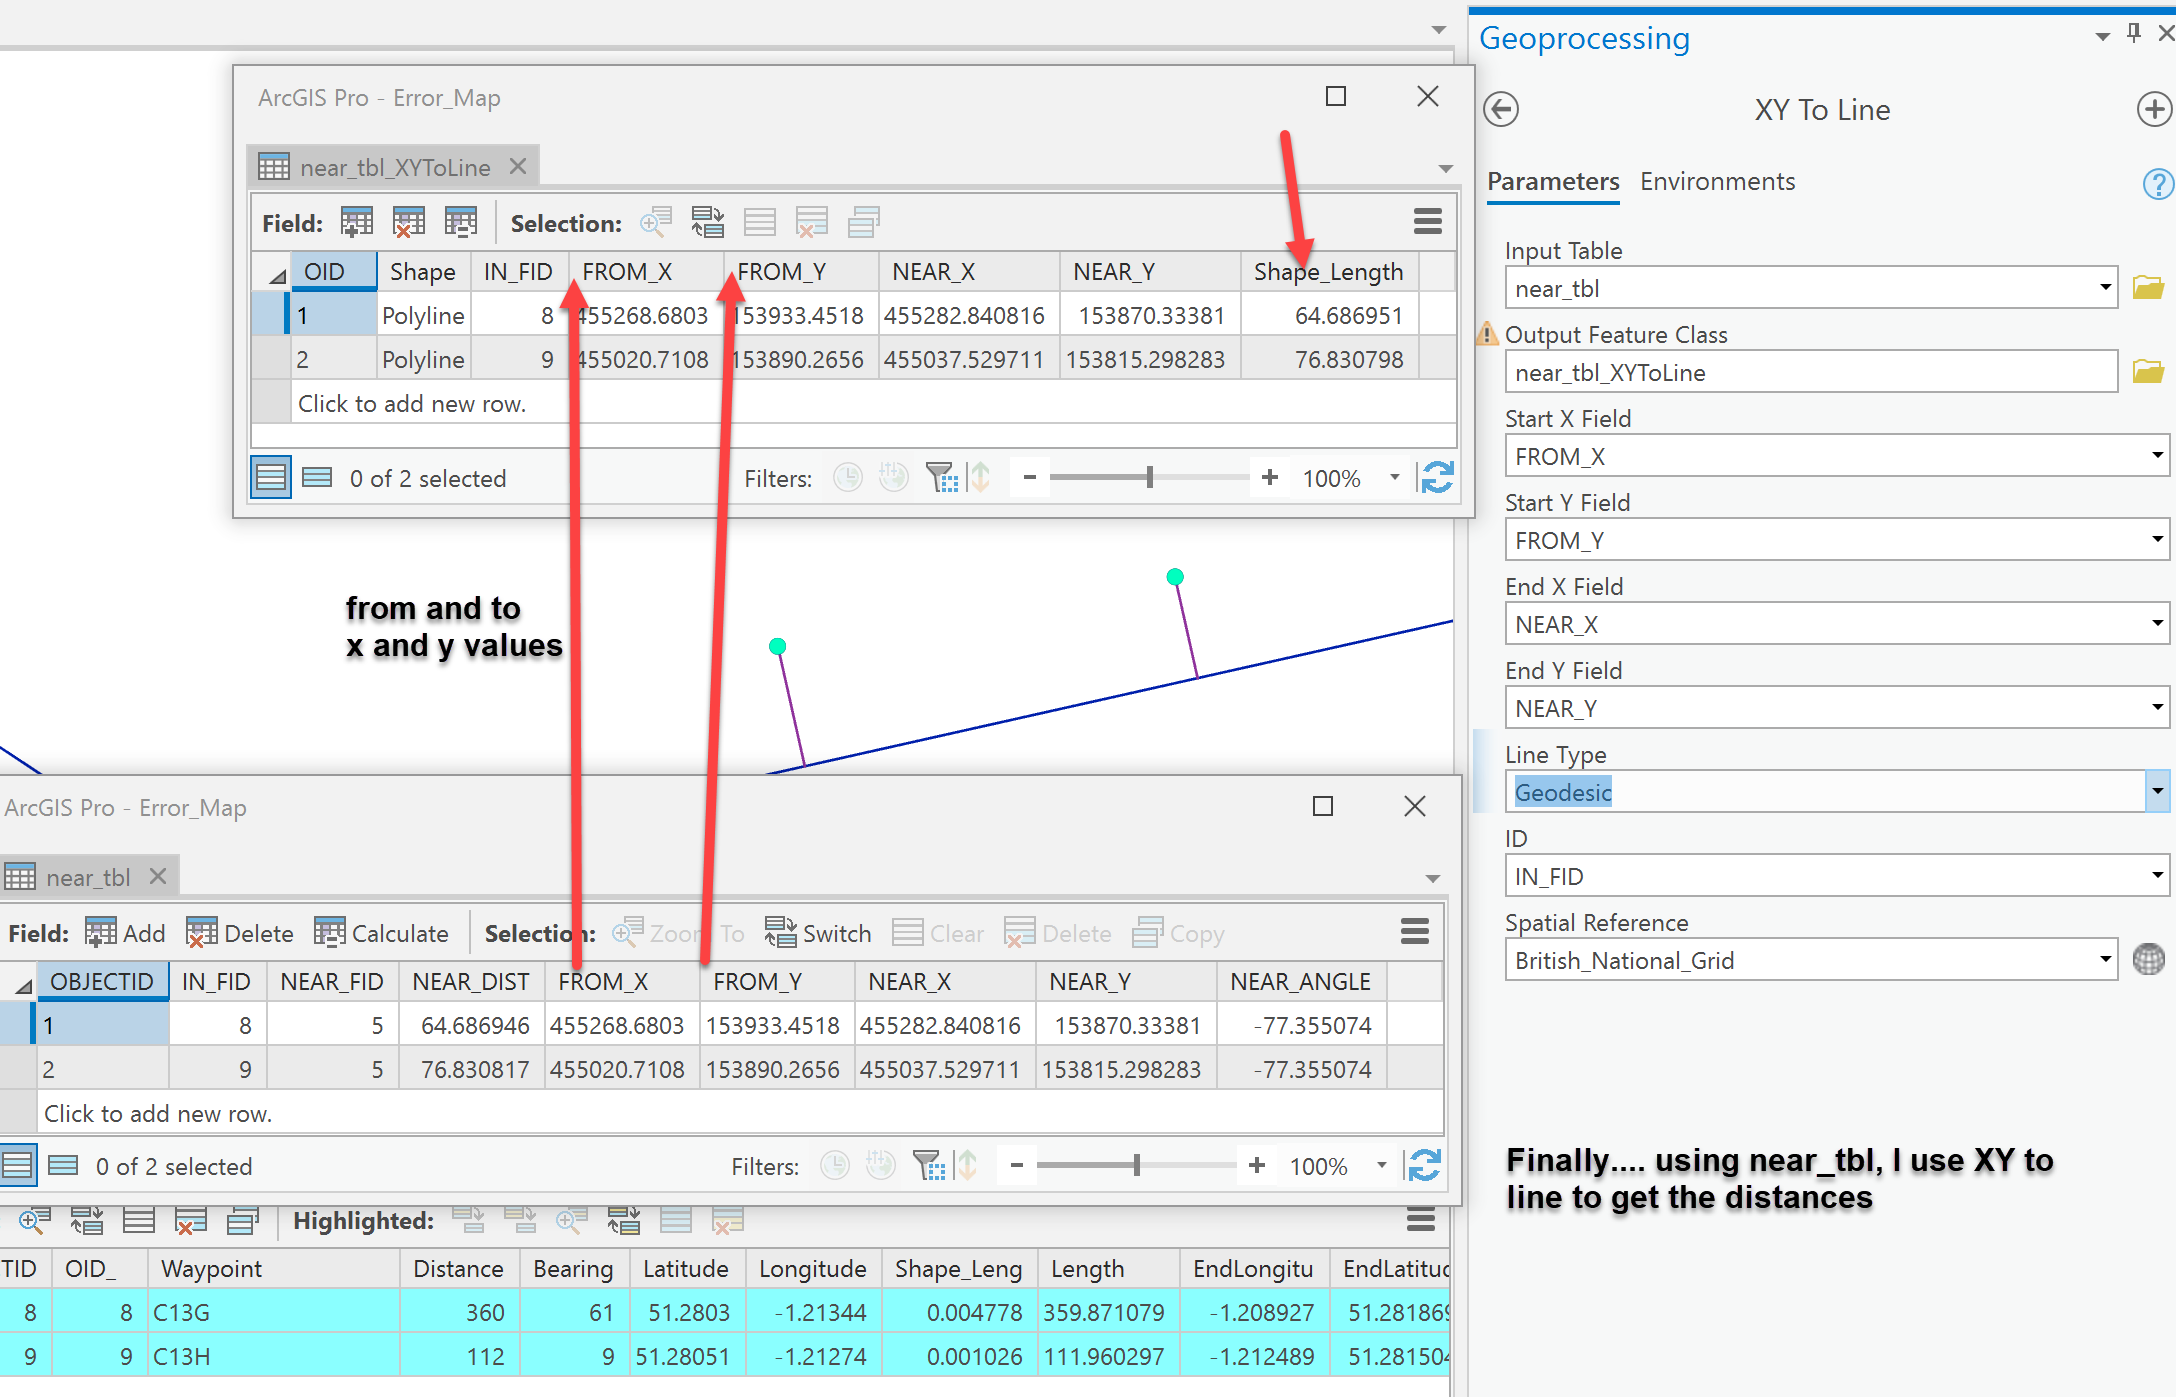
Ok... have a look
I used Near as Table to see how far those 2 points were from the line.
I then used XY to Line to produce the adjoining line.
- Mark as New
- Bookmark
- Subscribe
- Mute
- Subscribe to RSS Feed
- Permalink
Dan, this is great but reiterates what I've already determined.
The question is: what figures do you get for these two perpendicular distances when you calculate them using basic trigonometry? Are they the same as the mapped distances? Or do they differ from the mapped distances by
by -35% and -3.5%, as I've found? Assuming you find the same difference, this is the crux of my problem. Why do they differ?
- « Previous
-
- 1
- 2
- Next »
- « Previous
-
- 1
- 2
- Next »