- Home
- :
- All Communities
- :
- Industries
- :
- Telecommunications
- :
- Telecommunications Questions
- :
- Re: Create Parallel lines (ducts) from a quantity ...
- Subscribe to RSS Feed
- Mark Topic as New
- Mark Topic as Read
- Float this Topic for Current User
- Bookmark
- Subscribe
- Mute
- Printer Friendly Page
Create Parallel lines (ducts) from a quantity Attribute in ArcGIS Pro
- Mark as New
- Bookmark
- Subscribe
- Mute
- Subscribe to RSS Feed
- Permalink
Hello everyone,
I need help with creating parallel lines based on an attribute.
I explain myself better: let´s suppose you have a shape of lines, like streets and we call them TRENCHES.
Let suppose each line has an attribute that tells you how many ducts (or fiber cables) there are in the ground. I need a way to obtain a shape where all the ducts can be seen.
I manually tried to Copy parallel, so i.e. if the amount of ducts was 3, I selected by attribute all line segments with quantity 3 and then copy parallel 2. So 1 was the original line + 2 copied = 3.
What I need to obtain is a new shapefiles where you can see all the ducts (or cables).
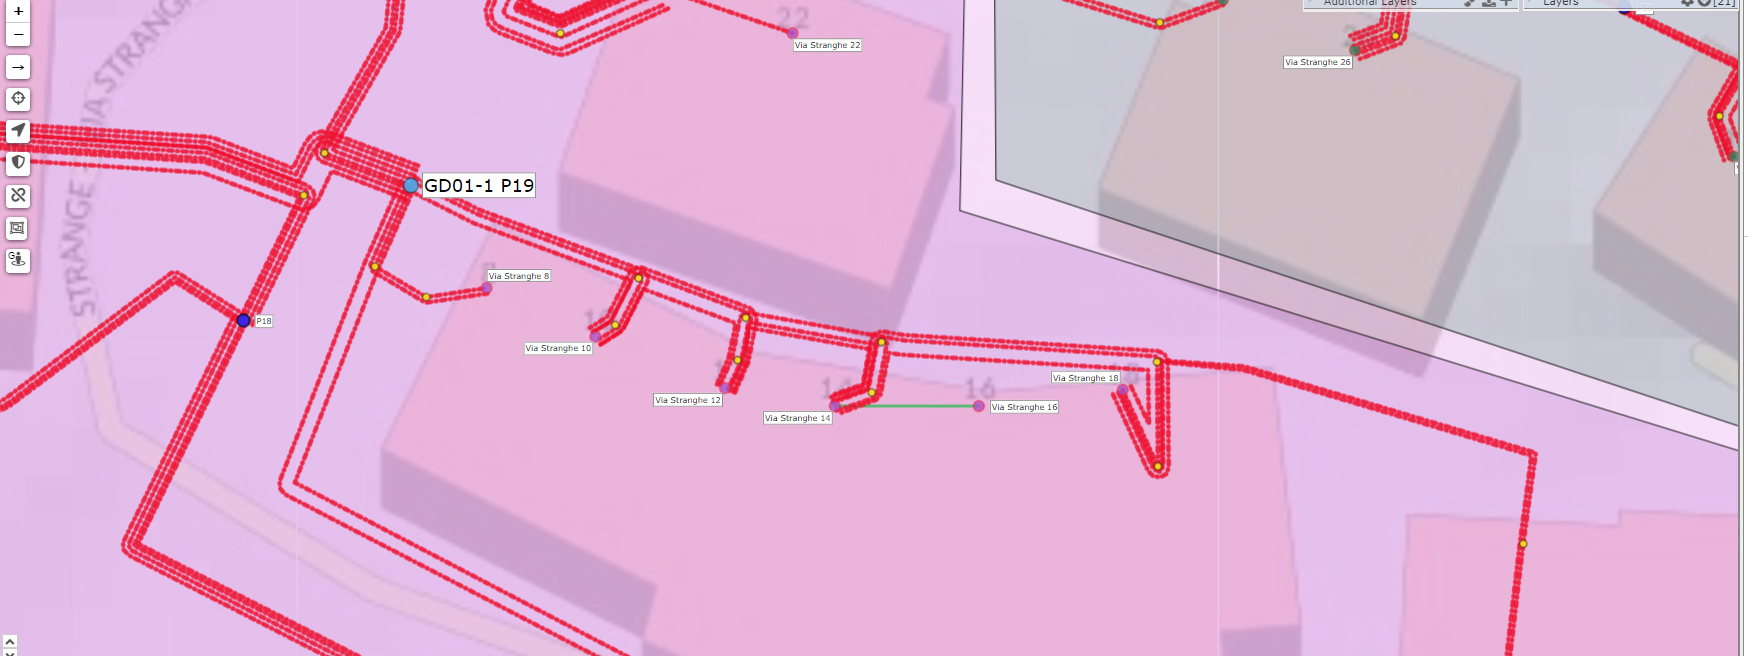
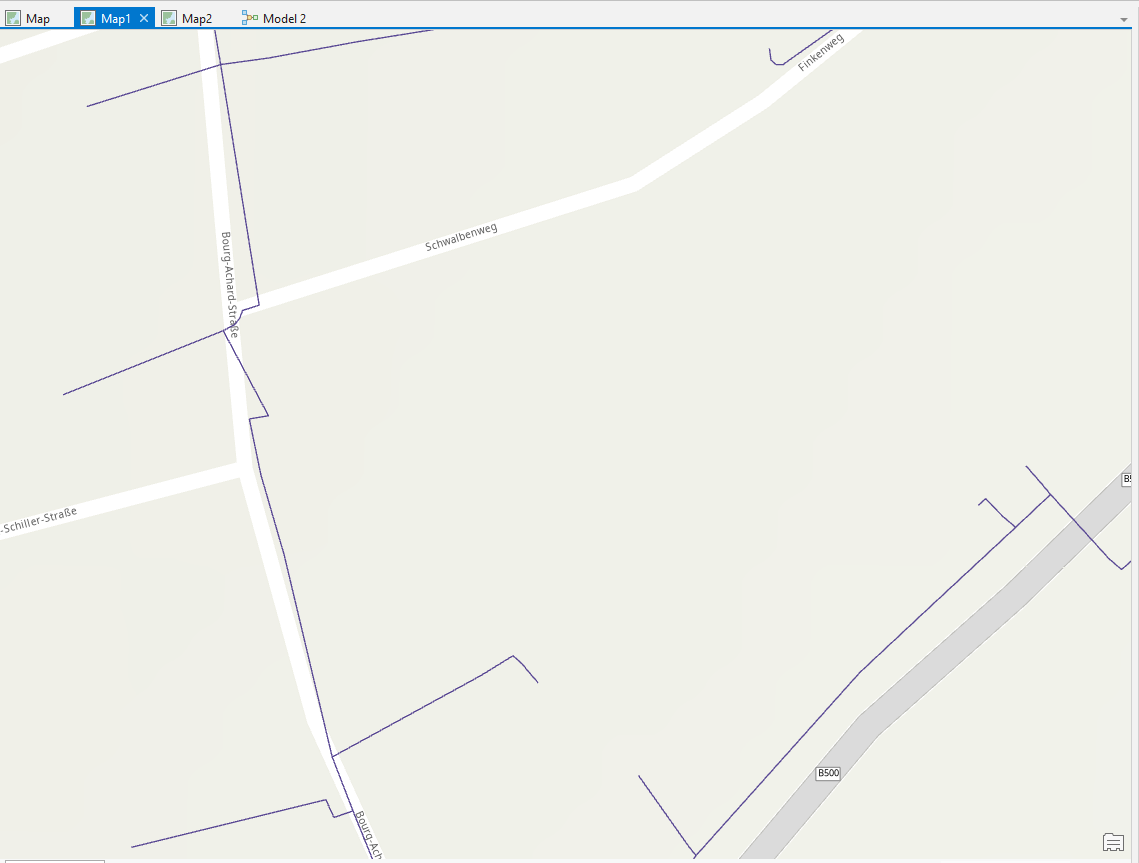
In pic 1 and pic 2 you cans see what I mean but done in a FTTH planning Software. I just was wondering if ArcGIS Pro could do something similar?
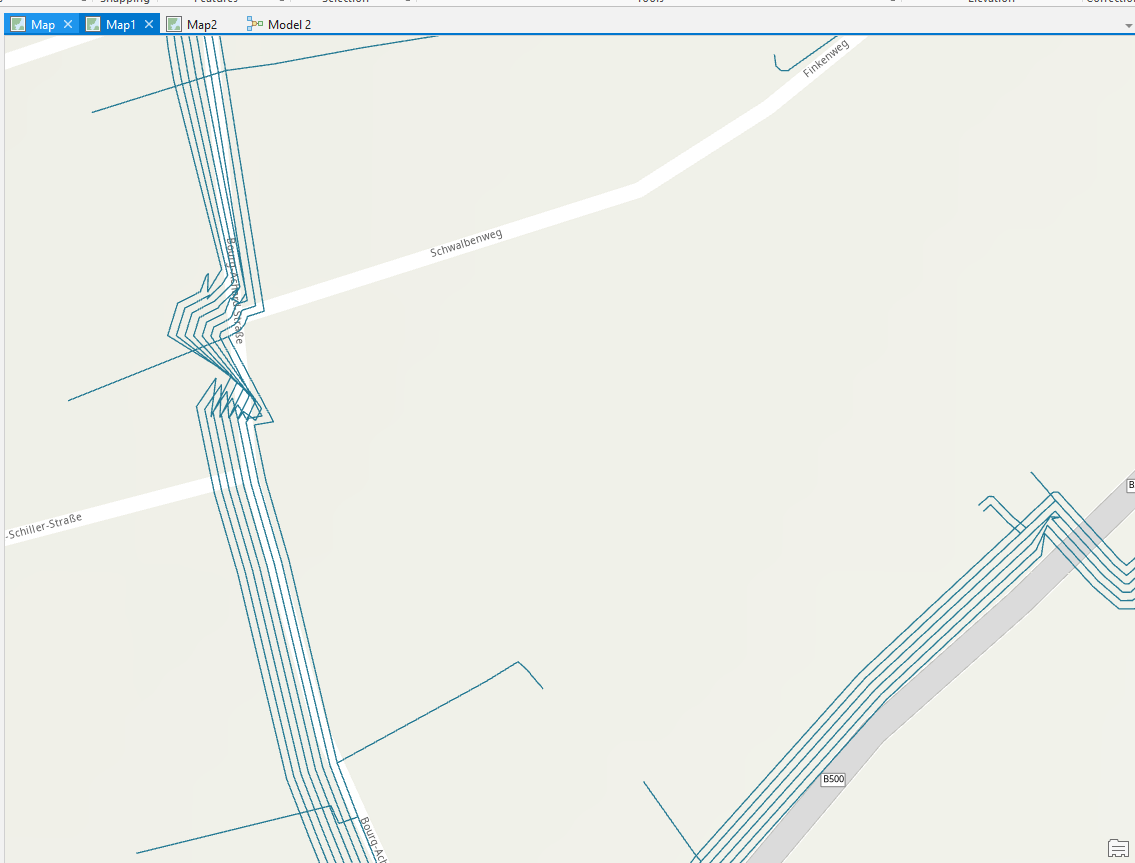
Pic 3 shows my attempt by manually copy parallel by selected attribute, but the results is not what I expected, and unfortunally Copy parallel cannot be added to a ModelBuilder.
Thanks a lot
Solved! Go to Solution.
Accepted Solutions
- Mark as New
- Bookmark
- Subscribe
- Mute
- Subscribe to RSS Feed
- Permalink
Hi Dorelia,
Thank you for sharing more details about the question. I think this is more towards a CAD or visualization workflow or format of the data on the map. Unfortunately, we don't have an Out-of-the-box editing tool that could generate this visualization.
But I have come across these use cases before and here are some of the workflow or options our users have tried.
Use Multi-Line Symbology
- Add additional symbol layers to represent the visualization of the ducts
- Pros - Simple and easy to create
- Cons - Only one feature being created, so all the data records are maintained within one row


Use Copy Parallel and edit the last vertice
- Use the "Copy Parallel" tool from the editing toolbox and generate the lines
- Then use the "edit vertice" tool to modify the end of the line
- Pros - Efficient creation of the parall lines at batch with a defined offset, each line is a separate feature
- Cons - Still need to edit the end vertice to achieve the final visualization


Use Trace Tool and control offset during an editing session
- This is the most common editing workflow I have seen from our users, but it is also the most manual workflow.
- Will start from the point and draw a short line to the offset location
- Then change the editing tool to "Trace", and click "O" from the keyboard to call out the "Trace Option", set the offset distance and other settings before completing the trace.
- Repeat the same process at the end of the line to add the vertice to close the line at the endpoint.
- Pros - The editor will have full control of the data creation, every line is also a separate feature
- Cons - No batch processing, time-consuming.


Out of the three common workflows, I would highly recommend Option 2 since it is much more efficient and you can focus on the editing at the merging point all at once.
Hopefully, these options are helpful for you.
- Mark as New
- Bookmark
- Subscribe
- Mute
- Subscribe to RSS Feed
- Permalink
Hi Dorelia,
Thank you for your post and it is a common question that we get asked regarding creating offset lines for utilities and telecom cables.
I did check out your pictures for the testing and you are getting very close to making it perfect. I would suggest you to continue adjust the parameters within the tool to achieve what you want from the other fiber planning tool. Please see my attempt below:

And you are right, the "Copy Parallel" tool is currently not available through ArcPy or Modelbuilider. But we do have a technical document explaining how to complete a similar workflow with a customized script. (See Technical Document).
Besides, if you are looking for robust Communications Data Management Solutions via ArcGIS and Solutions, please feel free to check out the Communications Data Management for ArcGIS Enterprise, a foundational template built on top of the Utility Network Management.
Communications Data Management for ArcGIS Enterprise v1.0 Resources:
Solution Overview: https://storymaps.arcgis.com/stories/6579c839d1874261ac735c1360ada6b3
Solution Documentation: https://doc.arcgis.com/en/arcgis-solutions/reference/introduction-to-communications-data-management-...
Network Management Workflows in ArcGIS Enterprise: https://storymaps.arcgis.com/stories/2b0da80ab0ff4f17bb2a2103a4095611
Communications Data Management for ArcGIS Enterprise v1.1 Updates
Solution Highlight: https://community.esri.com/t5/telecommunications-videos/telecom-gis-in-five-minutes-video-series-epi...
Solution Download: https://community.esri.com/t5/telecommunications-questions/communications-data-management-for-arcgis...
Solution Data Dictionary: https://experience.arcgis.com/experience/d307f8c5fc644185a5fdf82fb9f849eb
And in this specific solution, we are modeling Ducts as non-spatial features, where you can still visualize it within the diagram view.

Hopefully, this information can help you with your question.
- Mark as New
- Bookmark
- Subscribe
- Mute
- Subscribe to RSS Feed
- Permalink
Hello Jun Jie-Ma,
first of all I would like to thank you for your detailed answer, in fact I have checked all the links you advised me to read and found it very interesting. However, I need to ask you a professional opinion, it might help me further.
I have received a .lpk with 2 layers of my interest Schutzrohr (cladding ducts in blue) and Stammverband (feeder ducts in red). You can see in pic 1 and 2 that these look perfectly symmetric, as if they have been generated by a tool similar to copy parallel. But how do you think they have achieved this effect of "confluence" to a single point, in this case a connection point. I measure it out and it really doesn't seem to have been drawn by hand, it is far too perfect.
The wired thing is that I have been told this was obtained with ArcGIS, and obviously didn´t tell me how. I am just braking my head there!
Any ideas? Does any tool in the Network management solve this? Or any tool at all?
I really thank you in advance and look forward to your replay.
Kindest regards,
D.Z


- Mark as New
- Bookmark
- Subscribe
- Mute
- Subscribe to RSS Feed
- Permalink
Hi Dorelia,
Thank you for sharing more details about the question. I think this is more towards a CAD or visualization workflow or format of the data on the map. Unfortunately, we don't have an Out-of-the-box editing tool that could generate this visualization.
But I have come across these use cases before and here are some of the workflow or options our users have tried.
Use Multi-Line Symbology
- Add additional symbol layers to represent the visualization of the ducts
- Pros - Simple and easy to create
- Cons - Only one feature being created, so all the data records are maintained within one row
Use Copy Parallel and edit the last vertice
- Use the "Copy Parallel" tool from the editing toolbox and generate the lines
- Then use the "edit vertice" tool to modify the end of the line
- Pros - Efficient creation of the parall lines at batch with a defined offset, each line is a separate feature
- Cons - Still need to edit the end vertice to achieve the final visualization
Use Trace Tool and control offset during an editing session
- This is the most common editing workflow I have seen from our users, but it is also the most manual workflow.
- Will start from the point and draw a short line to the offset location
- Then change the editing tool to "Trace", and click "O" from the keyboard to call out the "Trace Option", set the offset distance and other settings before completing the trace.
- Repeat the same process at the end of the line to add the vertice to close the line at the endpoint.
- Pros - The editor will have full control of the data creation, every line is also a separate feature
- Cons - No batch processing, time-consuming.
Out of the three common workflows, I would highly recommend Option 2 since it is much more efficient and you can focus on the editing at the merging point all at once.
Hopefully, these options are helpful for you.
- Mark as New
- Bookmark
- Subscribe
- Mute
- Subscribe to RSS Feed
- Permalink
Thank you very much Jun Jie-Ma,
I understand what you mean and I also think Option 2 remains the better solution.
Is there a group/mailing list to receive updates on the new capabilities of the Network Management? Or it´s roadmap for the next few releases? Maybe this type of ducts visualization will be available one day.
Once again thank you for your time and kindest regards,
DZ
- Mark as New
- Bookmark
- Subscribe
- Mute
- Subscribe to RSS Feed
- Permalink
Hi Dorelia,
Here is a StoryMap we build to keep track of new demos and content for Network Management:
https://storymaps.arcgis.com/stories/19fd6813361a4ff585b528f77843f88c
We also have a weekly video series that talks about telecom-related GIS use cases:
https://storymaps.arcgis.com/stories/ae76602288144d7d9154c4ec335dd552
And we publish and promote blogs and articles periodically through this Telecom Channel so please stay tuned for those content as well.