- Home
- :
- All Communities
- :
- Industries
- :
- Science
- :
- Science Questions
- :
- How to interpolate weather data
- Subscribe to RSS Feed
- Mark Topic as New
- Mark Topic as Read
- Float this Topic for Current User
- Bookmark
- Subscribe
- Mute
- Printer Friendly Page
How to interpolate weather data
- Mark as New
- Bookmark
- Subscribe
- Mute
- Subscribe to RSS Feed
- Permalink
Hello,
I'm looking to create an interpolated surface from 5 weather stations spread throughout southern Ontario. The stations are roughly equidistant from each other, and have temp & precip data for the exact same times. Before, I typically used the Kriging tool inside 3D analyst. This time when I try it, it simply creates a single-colored square between the outer stations.
This is my working environment in ArcPro, with the 5 stations:
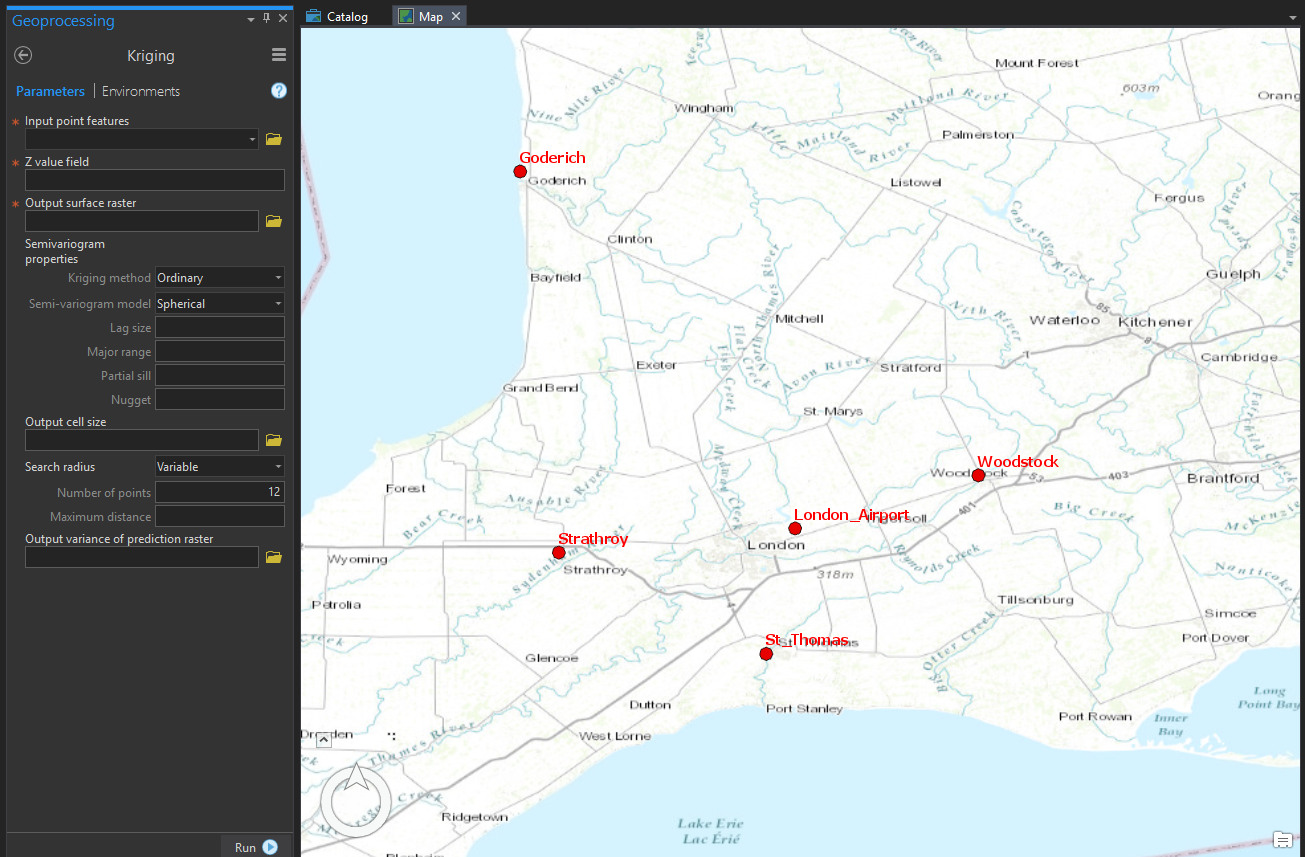
What would I put in the Parameters on the left? Is there perhaps another, better interpolation method in ArcPro?
- Mark as New
- Bookmark
- Subscribe
- Mute
- Subscribe to RSS Feed
- Permalink
cc Kevin Butler Dan Pisut?
Dawn Wright (she/her/hers), Ph.D. & GISP | Esri Chief Scientist
- Mark as New
- Bookmark
- Subscribe
- Mute
- Subscribe to RSS Feed
- Permalink
Malcolm,
You've run into a classic problem with interpolating meteorological data, a small number of sampling locations with a lot of measurements across time. None of the kriging methods in ArcGIS Pro deal with time explicitly. I suspect what is happening is that the Kriging tool is getting all of its neighbors from the same location so it sees very little variation in the data. Do you have access to the Geostatistical Analyst extension? If so, I suggest trying the Empirical Bayesian Kriging tool. It has an environment setting (Coincident Points) that will summarize all of your temporal observations down to a mean value. Five points is not a lot of information to build any interpolation model on. You many need to 'help' the model by providing additional explanatory variables. You can do this with either the EBK Regression Prediction tool or Forest Based Classification and Regression tool. This Learn lesson might help: https://learn.arcgis.com/en/projects/analyze-urban-heat-using-kriging/ Cheers.
- Mark as New
- Bookmark
- Subscribe
- Mute
- Subscribe to RSS Feed
- Permalink
Or look back in history and first approaches of dealing with climate data and allocation to points