These days, it is quite common for people to use the rasterio, rasterstats, numpy, or geopandas Python packages in their Raster processing/analysis workflows. This post aims to illustrate how some of these packages might be used to perform zonal statistics:
- rasterio
- rasterstats
- geopandas
- fiona
If you're ever used the Summarize Raster Within or Zonal Statistics tools and you've wondered a bit about what goes on behind the scenes his article will help break down a few of the processes.
Prerequisites:
A number of packages are required for the below script to work - some of these packages are dependent on gdal.
The easiest way to get started is to use Anaconda to create a new environment:
conda create -n raster python=3.7
conda install -n raster gdal
From there, you can use conda/pip to install the remainder of the packages:
- rasterio
- rasterstats
- descartes
- mapclassify
- geopandas
- fiona
- shapely
- matplotlib
Overview:
When you run a tool like Zonal Statistics or Summarize Raster Within, you are asked for a few things:
- Input Zone Layer
- Zone Field
- Input Raster Layer to Summarize
- Statistic Type
As an example, let's say you're working with this then:
- A polygon feature class of parcels
- Owner Name field
- DEM
- Average
In the equivalent workflow presented here, the following occurs: The polygon feature class is loaded into data frame > dissolved by the zone field > > statistics are calculated using the zones > the result is rasterized.
Begin by importing the required packages:
import fiona, rasterio
import geopandas as gpd
from rasterio.plot import show
import matplotlib.pyplot as plt
import rasterio.plot as rplt
from rasterio.features import rasterize
from rasterstats import zonal_stats
In order to run the required tools, it helps to view the data - the below help with adding a bit of interactivity:
def enum_items(source):
print("\n")
for ele in enumerate(source):
print(ele)
def list_columns(df):
field_list = list(df)
enum_items(field_list)
return field_list
These functions are used to load data into a geopandas dataframe for easy manipulation. Either an .shp or a File Geodatabase Feature class (the input vector layer).
def loadfc_as_gpd(fgdb):
layers = fiona.listlayers(fgdb)
enum_items(layers)
index = int(input("Which index to load? "))
fcgpd = gpd.read_file(fgdb,layer=layers[index])
return fcgpd
def loadshp_as_gpd(shp):
data = gpd.read_file(shp)
return data
If you want to filter the data before processing (e.g., maybe you only want to use parcels within a certain county):
def filter_gpd(fcgpd):
field_list = list_columns(fcgpd)
index = int(input("Filter by which field (index)? "))
field = field_list[index]
value = input("Enter value: ")
result = fcgpd[fcgpd[field] == value]
return result
Ideally, the input vector layer is in the same projection as the input raster layer. If it's not, this function can be used to re-project the vector layer to the raster's projection. The re-projected vector layer is plotted along with the raster data for visual inspection:
def reproject(fcgpd, raster):
proj = raster.crs.to_proj4()
print("Original vector layer projection: ", fcgpd.crs)
reproj = fcgpd.to_crs(proj)
print("New vector layer projection (PROJ4): ", reproj.crs)
fig, ax = plt.subplots(figsize=(15, 15))
rplt.show(raster, ax=ax)
reproj.plot(ax=ax, facecolor='none', edgecolor='red')
fig.show()
return reproj
- Note: the to_proj4 method is introduced in later versions of rasterio (e.g. 1.0.22).
This is used to perform a dissolve on the selected zone field:
def dissolve_gpd(df):
field_list = list_columns(df)
index = int(input("Dissolve by which field (index)? "))
dgpd = df.dissolve(by=field_list[index])
return dgpd
Here desired statistics are selected - I've included a list of common statistics but rasterstats offers additional options. You can actually select multiple statistics to calculate and this may be one reason why someone would choose to incorporate a tool like rasterstats in their workflow (Zonal Statistics as Table will let you get multiple statistics, but not Zonal Statistics/Summarize Raster Within😞
def stats_select():
stats_list = ['min', 'max', 'mean', 'count',
'sum', 'std', 'median', 'majority',
'minority', 'unique', 'range']
enum_items(stats_list)
indices = input("Enter raster statistics selections separated by space: ")
stats = list(indices.split())
out_stats = list()
for i in stats:
out_stats.append(stats_list[int(i)])
return out_stats
def get_zonal_stats(vector, raster, stats):
result = zonal_stats(vector, raster, stats=stats, geojson_out=True)
geostats = gpd.GeoDataFrame.from_features(result)
return geostats
The result of rasterstats' zonal_stats function is not a raster (e.g. .tif) by default so you must rasterize the result. In the previous function, the result is stored as GeoJSON in a geopandas dataframe and this is what gets rasterized to a .tif.
def stats_to_raster(zdf, raster, stats, out_raster, no_data='y'):
meta = raster.meta.copy()
out_shape = raster.shape
transform = raster.transform
dtype = raster.dtypes[0]
field_list = list_columns(stats)
index = int(input("Rasterize by which field? "))
zone = zdf[field_list[index]]
shapes = ((geom,value) for geom, value in zip(zdf.geometry, zone))
burned = rasterize(shapes=shapes, fill=0, out_shape=out_shape, transform=transform)
show(burned)
meta.update(dtype=rasterio.float32, nodata=0)
if no_data == 'y':
cutoff = min(zone.values)
print("Setting nodata cutoff to: ", cutoff)
burned[burned < cutoff] = 0
with rasterio.open(out_raster, 'w', **meta) as out:
out.write_band(1, burned)
print("Zonal Statistics Raster generated")
Altogether the script is:
import fiona, rasterio
import geopandas as gpd
from rasterio.plot import show
import matplotlib.pyplot as plt
import rasterio.plot as rplt
from rasterio.features import rasterize
from rasterstats import zonal_stats
def enum_items(source):
print("\n")
for ele in enumerate(source):
print(ele)
def list_columns(df):
field_list = list(df)
enum_items(field_list)
return field_list
def loadfc_as_gpd(fgdb):
layers = fiona.listlayers(fgdb)
enum_items(layers)
index = int(input("Which index to load? "))
fcgpd = gpd.read_file(fgdb,layer=layers[index])
return fcgpd
def loadshp_as_gpd(shp):
data = gpd.read_file(shp)
return data
def filter_gpd(fcgpd):
field_list = list_columns(fcgpd)
index = int(input("Filter by which field (index)? "))
field = field_list[index]
value = input("Enter value: ")
result = fcgpd[fcgpd[field] == value]
return result
def reproject(fcgpd, raster):
proj = raster.crs.to_proj4()
print("Original vector layer projection: ", fcgpd.crs)
reproj = fcgpd.to_crs(proj)
print("New vector layer projection (PROJ4): ", reproj.crs)
fig, ax = plt.subplots(figsize=(15, 15))
rplt.show(raster, ax=ax)
reproj.plot(ax=ax, facecolor='none', edgecolor='red')
fig.show()
return reproj
def dissolve_gpd(df):
field_list = list_columns(df)
index = int(input("Dissolve by which field (index)? "))
dgpd = df.dissolve(by=field_list[index])
return dgpd
def stats_select():
stats_list = ['min', 'max', 'mean', 'count',
'sum', 'std', 'median', 'majority',
'minority', 'unique', 'range']
enum_items(stats_list)
indices = input("Enter raster statistics selections separated by space: ")
stats = list(indices.split())
out_stats = list()
for i in stats:
out_stats.append(stats_list[int(i)])
return out_stats
def get_zonal_stats(vector, raster, stats):
result = zonal_stats(vector, raster, stats=stats, geojson_out=True)
geostats = gpd.GeoDataFrame.from_features(result)
return geostats
def stats_to_raster(zdf, raster, stats, out_raster, no_data='y'):
meta = raster.meta.copy()
out_shape = raster.shape
transform = raster.transform
dtype = raster.dtypes[0]
field_list = list_columns(stats)
index = int(input("Rasterize by which field? "))
zone = zdf[field_list[index]]
shapes = ((geom,value) for geom, value in zip(zdf.geometry, zone))
burned = rasterize(shapes=shapes, fill=0, out_shape=out_shape, transform=transform)
show(burned)
meta.update(dtype=rasterio.float32, nodata=0)
if no_data == 'y':
cutoff = min(zone.values)
print("Setting nodata cutoff to: ", cutoff)
burned[burned < cutoff] = 0
with rasterio.open(out_raster, 'w', **meta) as out:
out.write_band(1, burned)
print("Zonal Statistics Raster generated")
def main():
rst = '/path/to.raster.tif'
raster = rasterio.open(rst)
fgdb = '/path/to/fgdb.gdb'
vector = loadfc_as_gpd(fgdb)
p_vector = reproject(vector, raster)
d_vector = dissolve_gpd(p_vector)
out_rst = '/path/to/out.tif'
stats_to_get = stats_select()
zs = get_zonal_stats(d_vector, rst, stats_to_get)
stats_to_raster(zs, raster, stats_to_get, out_rst)
if __name__ == '__main__':
main()
Usage:
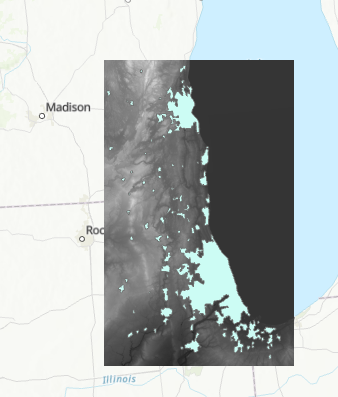
As an example, suppose we have the following data where the vector layer is a feature class of of urban areas and the raster layer is a DEM:
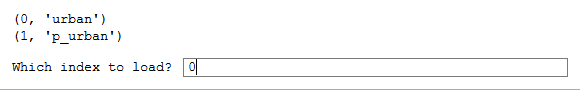
Start by setting the paths in the main function of the final script then run either in a terminal or a notebook (I ran it in a notebook). The first prompt will ask you which Feature Class in the File Geodatabase you would like to load. Enter the index:
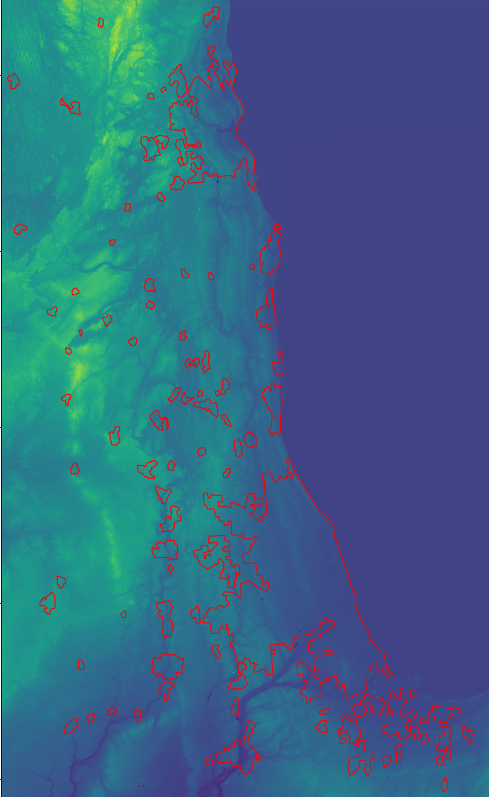
From review of the data, I know the vector layer needs to be projected so I included the reproject function in main. Here you can see that the data was re-projected to North America Albers Equal Area Conic (the proj4 representation of this projection is shown):

The result is plotted for visual inspection:
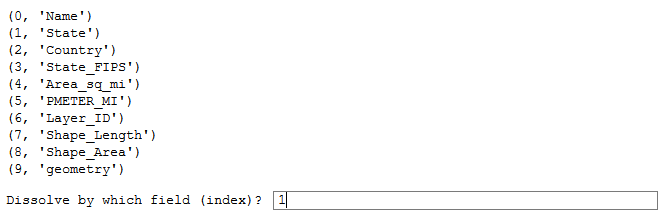
Next, a prompt to choose which field to dissolve on:
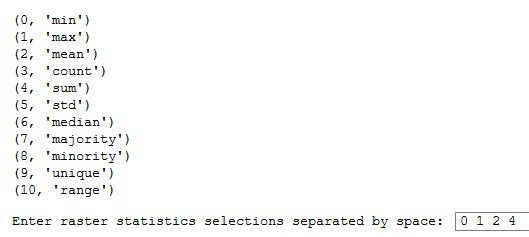
Here I select the statistics I want to calculate, separating the selections by space:
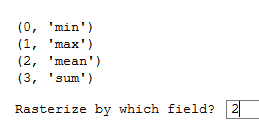
Finally, the statistic to use for rasterization is selected:
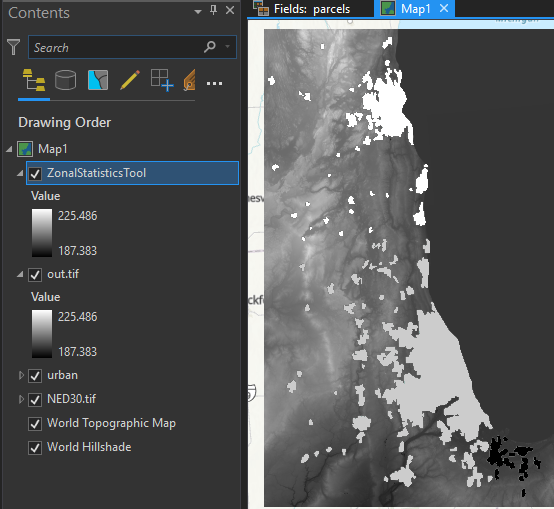
The result is plotted:
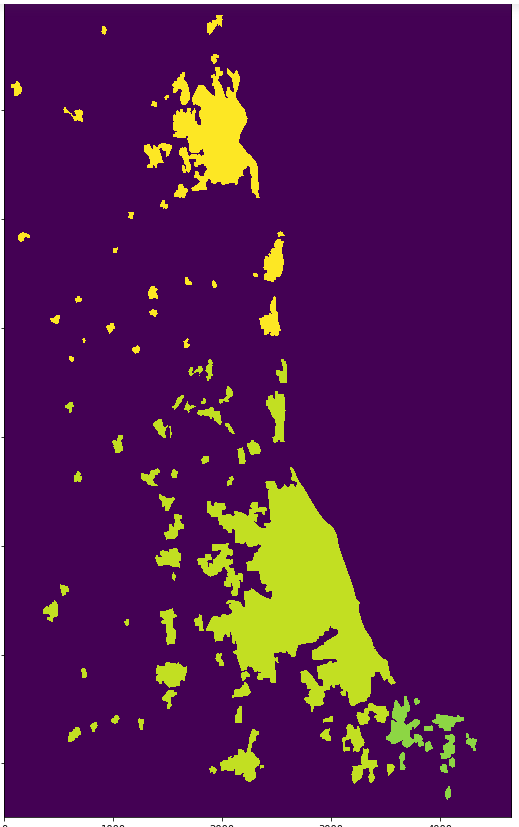
This compares well with the result you would get from the Zonal Statistics tool: