- Home
- :
- All Communities
- :
- Developers
- :
- Python
- :
- Python Questions
- :
- Re: Zonal Statistics as Table issue
- Subscribe to RSS Feed
- Mark Topic as New
- Mark Topic as Read
- Float this Topic for Current User
- Bookmark
- Subscribe
- Mute
- Printer Friendly Page
Zonal Statistics as Table issue
- Mark as New
- Bookmark
- Subscribe
- Mute
- Subscribe to RSS Feed
- Permalink
Hi,
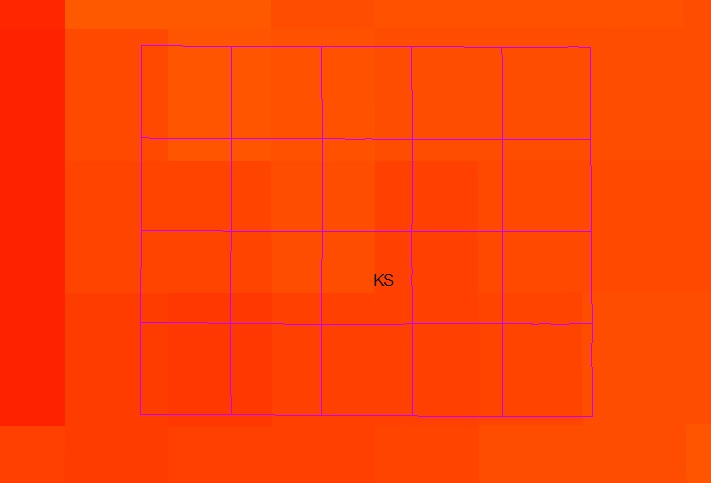
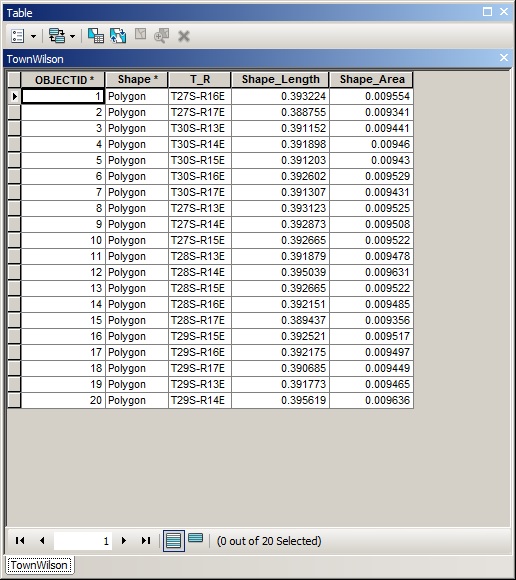
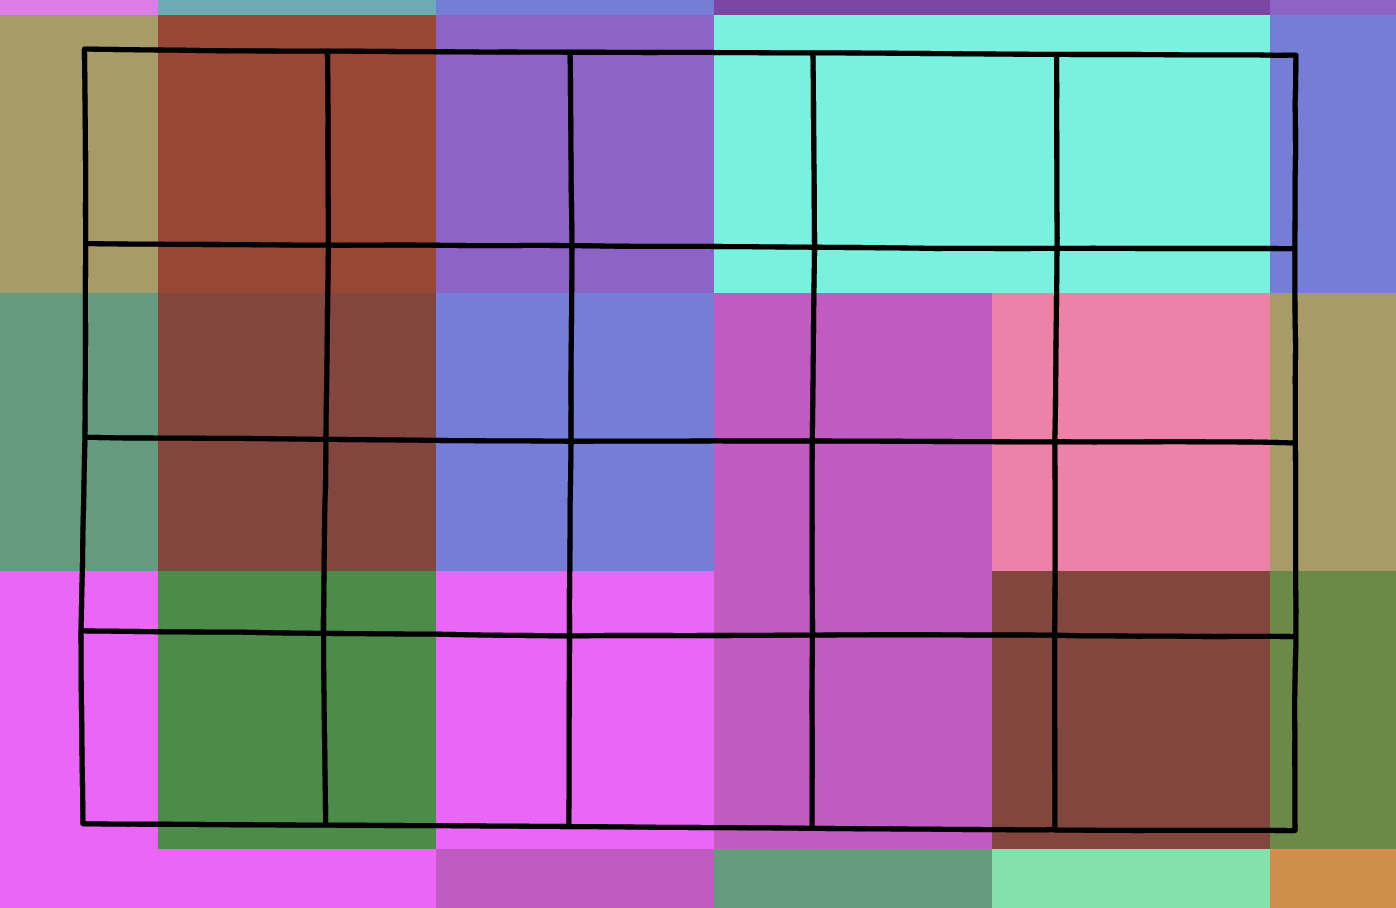
I need to estimate zonal statistics (MEAN) using the "Zonal Statistics as Table" tool in ArcGIS. I have the underlying raster in color (see the image below) and the polygon (grid, TownWilson) in pink color. As you can see, there are 20 grids in the TownWilson grid (shapefile). The grid IDs (T_R) are shown in the table below.
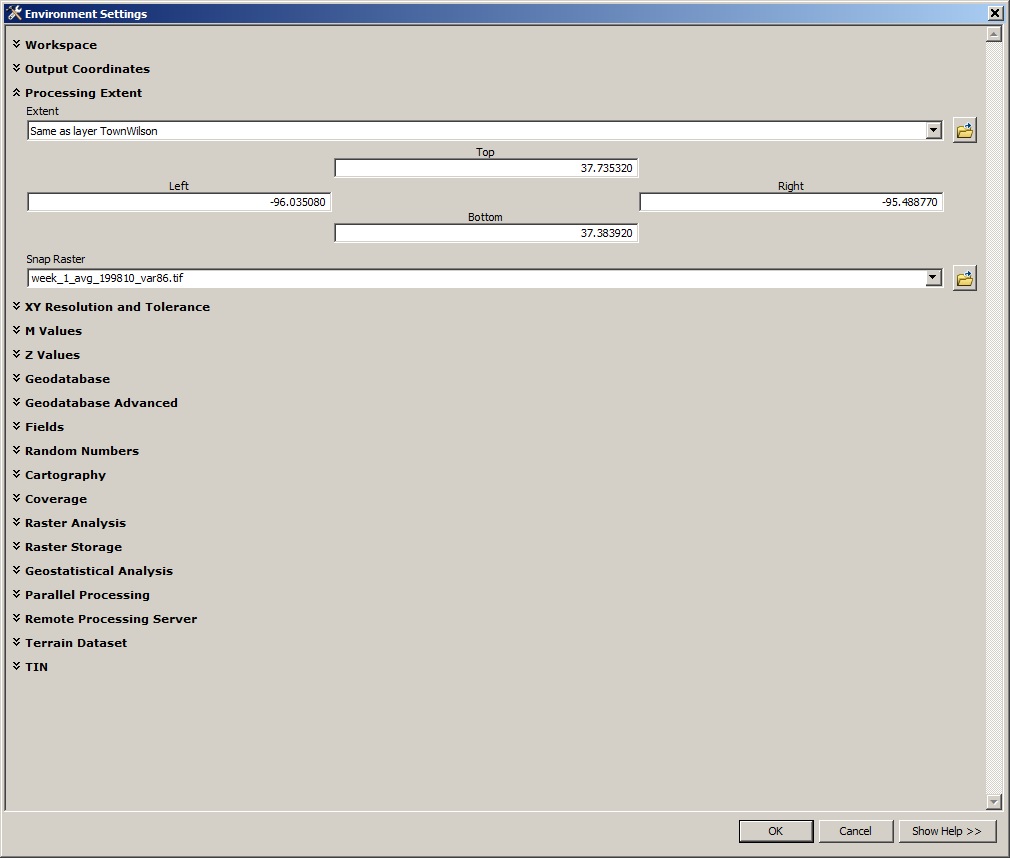
"Zonal Statistics as Table" tool and set up the environment variables as shown below.
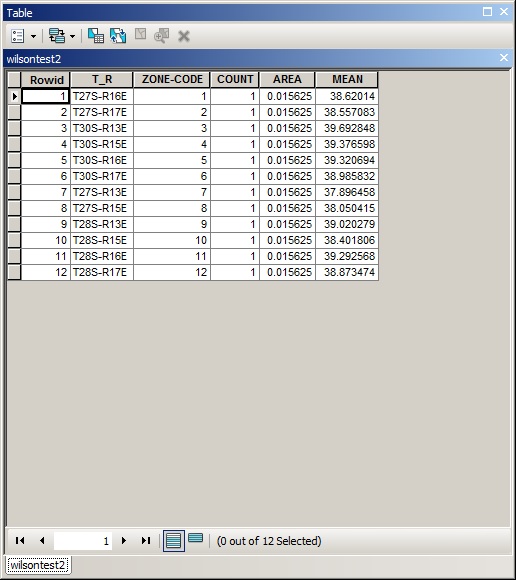
The output table and after the Zonal Statistics as Table run is complete is as follows. It shows zonal mean statistics for ONLY 12 grid IDs (T_R) out of 20 grid IDs in the original TownWilson table above.
Can somebody help me to obtain the statistics for all the T_R IDs in the grid? I cant understand what I am doing wrong here.
Thanks in advance for help.
- Mark as New
- Bookmark
- Subscribe
- Mute
- Subscribe to RSS Feed
- Permalink
Thanks Xander for the reply. Please download the attached data for the investigation.
- Mark as New
- Bookmark
- Subscribe
- Mute
- Subscribe to RSS Feed
- Permalink
before you attempt to do some work. You have a tad of an alignment issue.
I just used a random color scheme for the raster... which hasn't been clipped and covers the whole U.S.
That is the first thing I would do... clip, and figure out how you want to deal with the data. Do you want to resample the raster to a smaller scale so that you can summarize the variation within?
Your call, but data cleanup is the first order of business.
- Mark as New
- Bookmark
- Subscribe
- Mute
- Subscribe to RSS Feed
- Permalink
I just did a test configuring the analysis to run using 10m resolution and this was the result:

Each of the polygons has a result.
- Mark as New
- Bookmark
- Subscribe
- Mute
- Subscribe to RSS Feed
- Permalink
finally!
- Mark as New
- Bookmark
- Subscribe
- Mute
- Subscribe to RSS Feed
- Permalink
Thanks Xander. Did you re-sample raster to 10m resolution and then perform zonal statistics tool? What GIS tool you used to re-sample? I appreciate if you can let me know the steps followed to obtain the results/table above?
- Mark as New
- Bookmark
- Subscribe
- Mute
- Subscribe to RSS Feed
- Permalink
Xander,
I am going to try "BILINEAR" using Resample tool. Cell size of the original raster is in degrees (0.125 x 0.125). So, I found the degrees equivalent to 10m resolution is 0.0000898271 and the set environment variables as well. (Please see the screen shots below.)
Please let me know whether is this something you tried to obtain the Zonal Stat table above.
Thanks,

- Mark as New
- Bookmark
- Subscribe
- Mute
- Subscribe to RSS Feed
- Permalink
Look at your extent!!!
you haven't clipped the file first!
Do that before you do anything else. There is no way that the whole US resampled at 10 meters is going to be a good experience.
And why do you insist on using data in Geographic coordinates?
Clip everything to your area of interest.
Project to a locally used projection
Make sure everything is defined.
Then proceed!
- Mark as New
- Bookmark
- Subscribe
- Mute
- Subscribe to RSS Feed
- Permalink
Dan and Xander,
I have tried clipping the raster using the "Extract by Mask" tool in GIS for the grids shapefile (TownWilson) shown above. I made sure the raster and the shapefile are in the same Geographic coordinates projection. I have also set the environment variables as shown below. But, the output does not cover the grids. (See the images below)
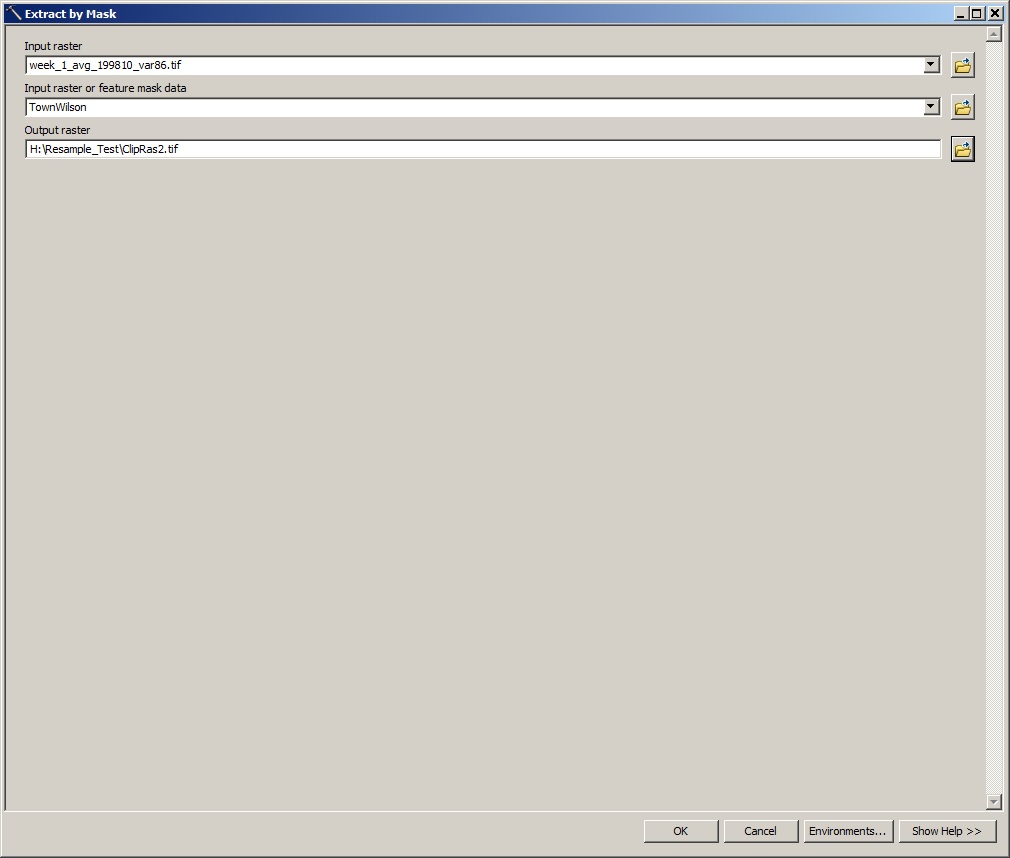

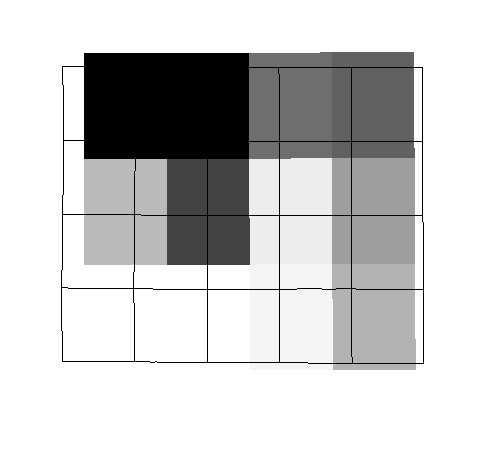
Output Raster does not cover the grids. Appreciate if you can guide what I am doing wrong here.
Thanks a lot again.
- Mark as New
- Bookmark
- Subscribe
- Mute
- Subscribe to RSS Feed
- Permalink
make the extent wider when you clip... I did say clip... clip the raster or make sure your mask is big enough if you are using extract by mask.
- Mark as New
- Bookmark
- Subscribe
- Mute
- Subscribe to RSS Feed
- Permalink
Dan and Xander,
I made it work and wrote a script to process over 500 rasters. Its working fine. Thanks a lot for both of you.