- Home
- :
- All Communities
- :
- Developers
- :
- Python
- :
- Python Questions
- :
- Zonal Statistics as Table issue
- Subscribe to RSS Feed
- Mark Topic as New
- Mark Topic as Read
- Float this Topic for Current User
- Bookmark
- Subscribe
- Mute
- Printer Friendly Page
Zonal Statistics as Table issue
- Mark as New
- Bookmark
- Subscribe
- Mute
- Subscribe to RSS Feed
- Permalink
Hi,
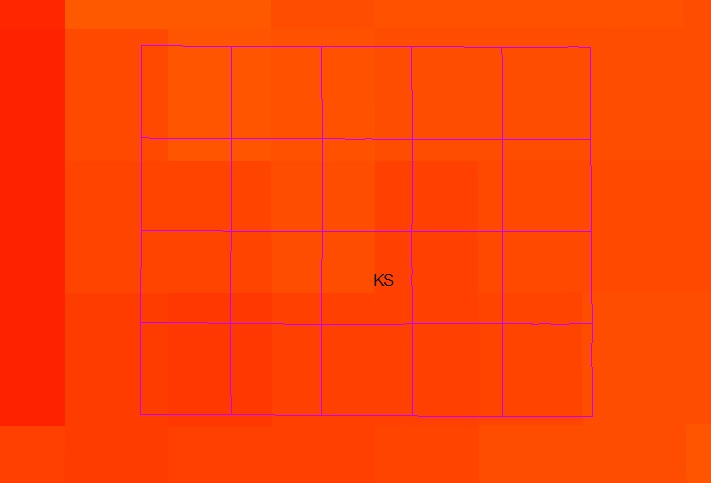
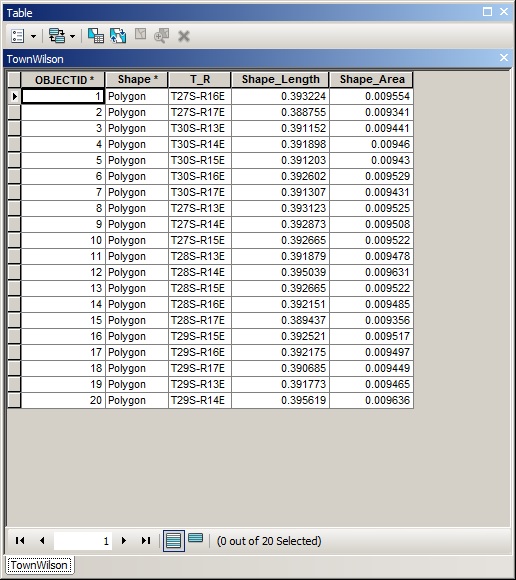
I need to estimate zonal statistics (MEAN) using the "Zonal Statistics as Table" tool in ArcGIS. I have the underlying raster in color (see the image below) and the polygon (grid, TownWilson) in pink color. As you can see, there are 20 grids in the TownWilson grid (shapefile). The grid IDs (T_R) are shown in the table below.
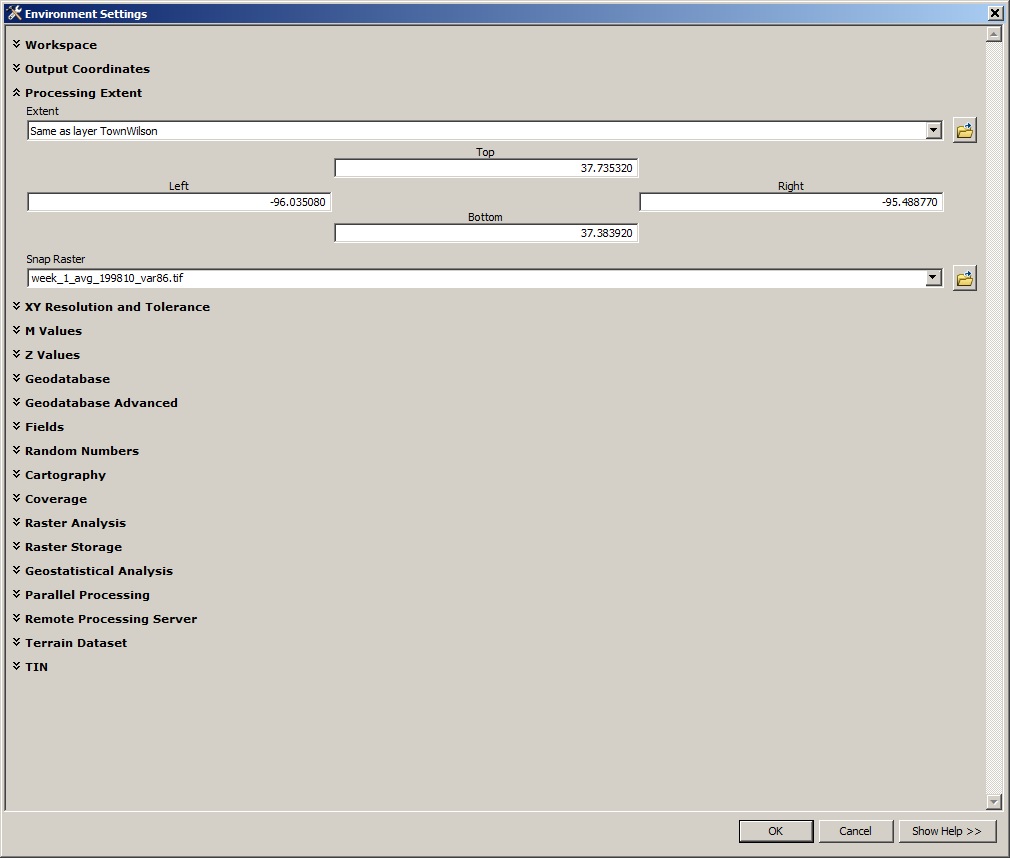
"Zonal Statistics as Table" tool and set up the environment variables as shown below.
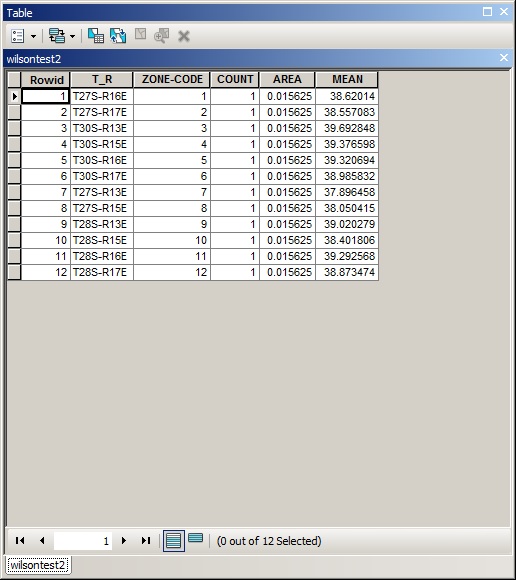
The output table and after the Zonal Statistics as Table run is complete is as follows. It shows zonal mean statistics for ONLY 12 grid IDs (T_R) out of 20 grid IDs in the original TownWilson table above.
Can somebody help me to obtain the statistics for all the T_R IDs in the grid? I cant understand what I am doing wrong here.
Thanks in advance for help.
- Mark as New
- Bookmark
- Subscribe
- Mute
- Subscribe to RSS Feed
- Permalink
Dan,
I would like to take the above comment back. I am getting the following error message. I have defined the spatial reference for all the raster files in the "Top_SM" folder as well as for the "TownWilson" shape file.
Please see the error message and script below.
Error:
Executing: zonalMeanRev
Start Time: Wed Jan 03 16:04:38 2018
Running script zonalMeanRev...
Failed script zonalMeanRev...
Traceback (most recent call last):
File "C:\Users\Desktop\Arkansas Flood\My_Phyton_Scripts\zonal_mean_rev.py", line 39, in <module>
prj_raster = arcpy.ProjectRaster_management(clip_raster, "#", "PROJCS['USA_Contiguous_Albers_Equal_Area_Conic',GEOGCS['GCS_North_American_1983',DATUM['D_North_American_1983',SPHEROID['GRS_1980',6378137.0,298.257222101]],PRIMEM['Greenwich',0.0],UNIT['Degree',0.0174532925199433]],PROJECTION['Albers'],PARAMETER['False_Easting',0.0],PARAMETER['False_Northing',0.0],PARAMETER['Central_Meridian',-96.0],PARAMETER['Standard_Parallel_1',29.5],PARAMETER['Standard_Parallel_2',45.5],PARAMETER['Latitude_Of_Origin',37.5],UNIT['Meter',1.0]]", "BILINEAR", "10 10", "", "", "GEOGCS['GCS_North_American_1983',DATUM['D_North_American_1983',SPHEROID['GRS_1980',6378137.0,298.257222101]],PRIMEM['Greenwich',0.0],UNIT['Degree',0.0174532925199433]]")
File "c:\program files (x86)\arcgis\desktop10.4\arcpy\arcpy\management.py", line 9025, in ProjectRaster
raise e
ExecuteError: ERROR 999999: Error executing function.
General function failure [week_4_avg_200609_var86_Clip5]
General function failure [fras_blk_week_4_avg_200609_var86_Clip5]
No spatial reference exists.
The table was not found. [week_4_avg_200609_var86_Clip5]
Failed to execute (ProjectRaster).
Failed to execute (zonalMeanRev).###############################
import arcpy, os, arcinfo
from arcpy import env
from arcpy.sa import *
arcpy.env.overwriteOutput = True
arcpy.CheckOutExtension("Spatial")
env.workspace = "H:/outRaster/Rasters/Top_SM"
watershedFeat = "H:/Arkansas Flood/KS_new.gdb/TownWilson"
outDir = "H:/Table/"
x = arcpy.ListRasters()
for raster in arcpy.ListRasters():
raster_name = os.path.basename(raster).rstrip(os.path.splitext(raster)[1])
## Clip Raster Dataset by known extent - Left Bottom Right Top
clip_raster = arcpy.Clip_management(raster, "-96.150 37.382844 -95.365 37.736391", "#", "#", "#", "NONE")
# Process: Project Raster
prj_raster = arcpy.ProjectRaster_management(clip_raster, "#", "PROJCS['USA_Contiguous_Albers_Equal_Area_Conic',GEOGCS['GCS_North_American_1983',DATUM['D_North_American_1983',SPHEROID['GRS_1980',6378137.0,298.257222101]],PRIMEM['Greenwich',0.0],UNIT['Degree',0.0174532925199433]],PROJECTION['Albers'],PARAMETER['False_Easting',0.0],PARAMETER['False_Northing',0.0],PARAMETER['Central_Meridian',-96.0],PARAMETER['Standard_Parallel_1',29.5],PARAMETER['Standard_Parallel_2',45.5],PARAMETER['Latitude_Of_Origin',37.5],UNIT['Meter',1.0]]", "BILINEAR", "10 10", "", "", "GEOGCS['GCS_North_American_1983',DATUM['D_North_American_1983',SPHEROID['GRS_1980',6378137.0,298.257222101]],PRIMEM['Greenwich',0.0],UNIT['Degree',0.0174532925199433]]")
outTable = outDir + raster_name + "_TBL.dbf"
arcpy.gp.ZonalStatisticsAsTable(watershedFeat,"T_R", prj_raster, outTable,"NODATA","MEAN")
arcpy.CheckInExtension("Spatial")- Mark as New
- Bookmark
- Subscribe
- Mute
- Subscribe to RSS Feed
- Permalink
Code formatting the basics++ so we can read the code
'Defined the projection' ... If you 'defined' files that weren't in this projection then you will have problems.
If a file did NOT have a defined coordinate system, you 'define' it to what it is.
If it isn't in the coordinate system you want, then you Project it using the Project tool
- Get all the data you need into one known coordinate system
- Clip all the data to your study area (your 'area of interest' AOI)
- Proceed with analysis
- Mark as New
- Bookmark
- Subscribe
- Mute
- Subscribe to RSS Feed
- Permalink
Dan,
I have formatted the text above to better read the code. I have already defined the projection for all the rasters.
- Mark as New
- Bookmark
- Subscribe
- Mute
- Subscribe to RSS Feed
- Permalink
Did the inputs have a 'defined coordinate system' first????
You can't project something that doesn't have a known coordinate system
- Mark as New
- Bookmark
- Subscribe
- Mute
- Subscribe to RSS Feed
- Permalink
Yes. All the input rasters have a defined coordinate system.
- Mark as New
- Bookmark
- Subscribe
- Mute
- Subscribe to RSS Feed
- Permalink
I think you are missing my point.
- When you got them, did they have one already defined? and what was it?
- or... did you define it? and what did you define it as?
If they didn't have one to begin with, then you need to define one... the one that it is... not! what you want it to be
If they were already defined, did you check to make sure that the defined projection was reasonable and correct?
Nothing seems to have helped so far in the advice department, so I will defer to others to try. Good luck
- Mark as New
- Bookmark
- Subscribe
- Mute
- Subscribe to RSS Feed
- Permalink
No. The files did not have a projection defined. It was a variable extracted from netCDF files so I defined the projection and saved as a .tif raster. Please see the line that defines the raster below.
proj_ras = arcpy.ProjectRaster_management(outfile, "C:/Users/Desktop/weekly_avg_project/project_ras","GEOGCS['GCS_North_American_1983',DATUM['D_North_American_1983',SPHEROID['GRS_1980',6378137.0,298.257222101]],PRIMEM['Greenwich',0.0],UNIT['Degree',0.0174532925199433]]", "NEAREST", "0.125 0.125", "NAD_1983_To_WGS_1984_1", "", "GEOGCS['GCS_WGS_1984',DATUM['D_WGS_1984',SPHEROID['WGS_1984',6378137.0,298.257223563]],PRIMEM['Greenwich',0.0],UNIT['Degree',0.0174532925199433]]")- Mark as New
- Bookmark
- Subscribe
- Mute
- Subscribe to RSS Feed
- Permalink
so... was that from Geographic to a Geographic projection?
but your want your output file to be in planar units... like in a UTM, so you can have metric cell size resolutions ie 10 m
If that was the case, it is pretty well pointless to project from a GCS to another GCS when you want everything summarized in planar units.
- Mark as New
- Bookmark
- Subscribe
- Mute
- Subscribe to RSS Feed
- Permalink
I used the above Geographic projection to be compatible with other shapefiles and rasters. But, in the code above I convert the projection from "GCS_North_American_1983" to "USA_Contiguous_Albers_Equal_Area_Conic projection" so it gives the cell size in meters.
Are you saying, extract and convert the netCDF variable to UTM projection?
- Mark as New
- Bookmark
- Subscribe
- Mute
- Subscribe to RSS Feed
- Permalink
http://desktop.arcgis.com/en/arcmap/latest/tools/data-management-toolbox/project-raster.htm
ProjectRaster_management (in_raster, out_raster, out_coor_system, {resampling_type}, {cell_size}, {geographic_transform}, {Registration_Point}, {in_coor_system})
proj_ras = arcpy.ProjectRaster_management( outfile, "...project_ras","GEOGCS['GCS_North_American_1983',DATUM['D_North_American_1983',SPHEROID['GRS_1980',6378137.0,298.257222101]],PRIMEM['Greenwich',0.0],UNIT['Degree',0.0174532925199433]]", "NEAREST", "0.125 0.125", "NAD_1983_To_WGS_1984_1", "", "GEOGCS['GCS_WGS_1984',DATUM['D_WGS_1984',SPHEROID['WGS_1984',6378137.0,298.257223563]],PRIMEM['Greenwich',0.0],UNIT['Degree',0.0174532925199433]]")
inraster - outfile,
out_raster - your raster which will be an esri grid since you didn't specify a *.tif file extension
out_coor_system - looks geographic to me
resampling - nearest .... only suitable for nominal/ordinal data, ... interval/ratio data might be better served by one of the others, but ok
cell size 0.125 degrees .... certainly not equivalent to 10 m except very near the North pole
geographic_transform - not sure if needed given the other stuff but ok,
the rest is blank, like the input coordinate system