- Home
- :
- All Communities
- :
- Developers
- :
- Python
- :
- Python Questions
- :
- Zonal Statistics as Table issue
- Subscribe to RSS Feed
- Mark Topic as New
- Mark Topic as Read
- Float this Topic for Current User
- Bookmark
- Subscribe
- Mute
- Printer Friendly Page
Zonal Statistics as Table issue
- Mark as New
- Bookmark
- Subscribe
- Mute
- Subscribe to RSS Feed
- Permalink
Hi,
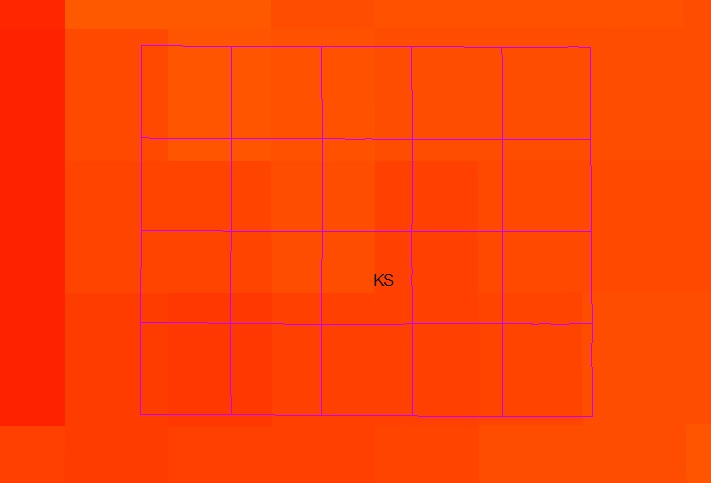
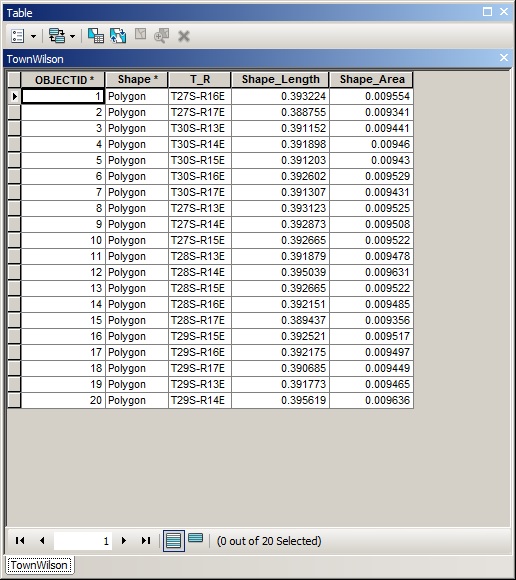
I need to estimate zonal statistics (MEAN) using the "Zonal Statistics as Table" tool in ArcGIS. I have the underlying raster in color (see the image below) and the polygon (grid, TownWilson) in pink color. As you can see, there are 20 grids in the TownWilson grid (shapefile). The grid IDs (T_R) are shown in the table below.
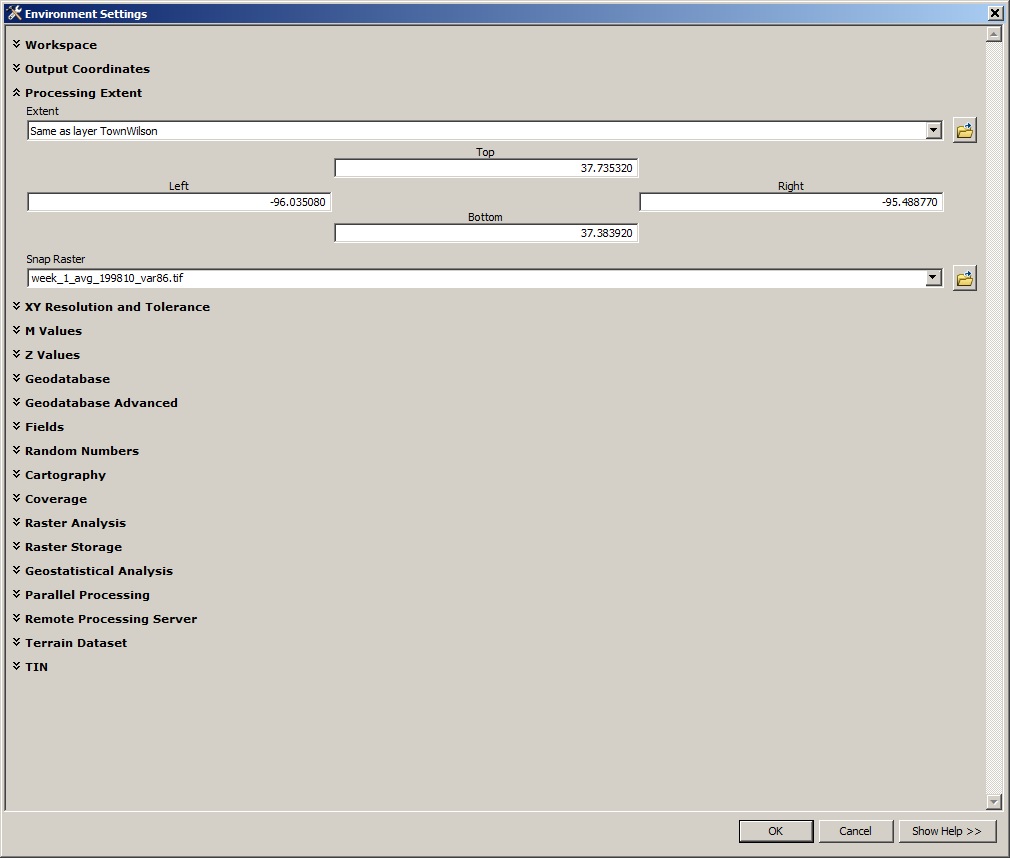
"Zonal Statistics as Table" tool and set up the environment variables as shown below.
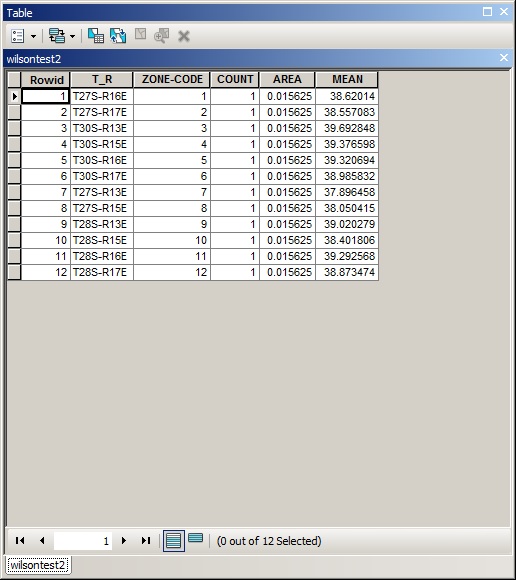
The output table and after the Zonal Statistics as Table run is complete is as follows. It shows zonal mean statistics for ONLY 12 grid IDs (T_R) out of 20 grid IDs in the original TownWilson table above.
Can somebody help me to obtain the statistics for all the T_R IDs in the grid? I cant understand what I am doing wrong here.
Thanks in advance for help.
- Mark as New
- Bookmark
- Subscribe
- Mute
- Subscribe to RSS Feed
- Permalink
Dan,
Please see my code complete code below which extract variable from netCDf file, project and save as .tif file.
import arcpy, sys
from arcpy import env
from arcpy.sa import *
import time
# Input data source
arcpy.env.workspace = r"C:/Users/Desktop/weekly_avg_project"
arcpy.env.overwriteOutput = True
# Set output folder
OutputFolder = r"C:/Users/Desktop/weekly_avg_project/output"
# Loop through a list of files in the workspace
NCfiles = arcpy.ListFiles("*.nc")
start = time.time()NCfiles = arcpy.ListFiles("*.nc")
start = time.time()
for filename in NCfiles:
print("Processing: " + filename)
inNCfiles = arcpy.env.workspace + "//" + filename
fileroot = filename[0:(len(filename)-3)] + '_var86'
TempLayerFile = "SM_amount"
outRaster = OutputFolder + "//" + fileroot
# Process: Make NetCDF Raster Layer
outfile = arcpy.MakeNetCDFRasterLayer_md(filename, "var86", "lon", "lat", TempLayerFile, "", "", "BY_VALUE")
proj_ras = arcpy.ProjectRaster_management(outfile, "C:/Users/Desktop/weekly_avg_project/project_ras","PROJCS['USA_Contiguous_Albers_Equal_Area_Conic',GEOGCS['GCS_North_American_1983',DATUM['D_North_American_1983',SPHEROID['GRS_1980',6378137.0,298.257222101]],PRIMEM['Greenwich',0.0],UNIT['Degree',0.0174532925199433]],PROJECTION['Albers'],PARAMETER['False_Easting',0.0],PARAMETER['False_Northing',0.0],PARAMETER['Central_Meridian',-96.0],PARAMETER['Standard_Parallel_1',29.5],PARAMETER['Standard_Parallel_2',45.5],PARAMETER['Latitude_Of_Origin',37.5],UNIT['Meter',1.0]]", "BILINEAR", "10 10", "NAD_1983_To_WGS_1984_1", "", "GEOGCS['GCS_WGS_1984',DATUM['D_WGS_1984',SPHEROID['WGS_1984',6378137.0,298.257223563]],PRIMEM['Greenwich',0.0],UNIT['Degree',0.0174532925199433]]")
# Process: Copy Raster
arcpy.CopyRaster_management(proj_ras, outRaster + ".tif", "", "", "", "NONE", "NONE", "")- Mark as New
- Bookmark
- Subscribe
- Mute
- Subscribe to RSS Feed
- Permalink
Dan and Xander,
Thanks for both of you for the help provided throughout. I figured that out and its working now. I have tested few rasters manually.
- Mark as New
- Bookmark
- Subscribe
- Mute
- Subscribe to RSS Feed
- Permalink
Thanks Dan. Do you suggest me to re-sample the raster for 10m resolution (as Xander finds out) before perform the zonal statistics.?
- Mark as New
- Bookmark
- Subscribe
- Mute
- Subscribe to RSS Feed
- Permalink
Resample .... to resample raster or even Copy Raster, but you would need to specify the cell size, extent and snap raster in the Environments tab of that tool
- Mark as New
- Bookmark
- Subscribe
- Mute
- Subscribe to RSS Feed
- Permalink
I will try this. Any suggestion of what re-sampling technique I should use. Nearest/Bilinear/Cubic? The raster data has soil moisture.
- Mark as New
- Bookmark
- Subscribe
- Mute
- Subscribe to RSS Feed
- Permalink
the help provides some guidance, but I wouldn't go with 'nearest' since it is generally for categorical data
- « Previous
- Next »
- « Previous
- Next »