- Home
- :
- All Communities
- :
- Developers
- :
- Python
- :
- Python Questions
- :
- Re: Scatter plot of two rasters
- Subscribe to RSS Feed
- Mark Topic as New
- Mark Topic as Read
- Float this Topic for Current User
- Bookmark
- Subscribe
- Mute
- Printer Friendly Page
- Mark as New
- Bookmark
- Subscribe
- Mute
- Subscribe to RSS Feed
- Permalink
Xander Bakker and Dan Patterson , Kindly your cooperation is highly appreciate.
I have two raster file, i want to perform Scatter plot of those raster . I found one code that is written by Dan Patterson
Below code
from matplotlib import pyplot as plt
xs = [1,3,2,5,6,4] # Which fomart of data i have to give here?
ys = [3,2,1,5,3,2]
plt.scatter(xs, ys)
main_title ="My first graph"
plt.title(main_title, loc='center') #loc is either left, right or center
plt.minorticks_on()
plt.tick_params(which='major', direction='in', length=6, width=2)
plt.tick_params(which='minor', direction='in', length=4, width=2)
plt.show()Earlier Dan suggest to someone convert those raster to arrays. I followed the same but could not solve it. How to process tiff to array.
how do i execute two raster in X and Y axis. I have tiff images.
Branched from Perform Raster Calculation from Multiple Sub-folder Using ArcPy
Solved! Go to Solution.
- Mark as New
- Bookmark
- Subscribe
- Mute
- Subscribe to RSS Feed
- Permalink
xander_bakker, Thank you. For my case i need to compare all the pixels corresponding to same latitude and longitude.
- Mark as New
- Bookmark
- Subscribe
- Mute
- Subscribe to RSS Feed
- Permalink
Follow Neil's and Xander's advice. A plot like that is going to show nothing more than a scaled down version. Calculate the statistical parameters of both variables and summarize in tabular form. This is a classic example of a graph adding nothing to the analysis or presentation. In fact, the association between the variables is better shown in mapped form since the spatial dimension is explicit.
Is this a requirement for some project? If so, gently suggest to the proponent that better means of examining the relationship are available.
- Mark as New
- Bookmark
- Subscribe
- Mute
- Subscribe to RSS Feed
- Permalink
Dan Patterson Thank you. Yes . This graph require for my research project. I am PhD scholar. I am going to publish a paper How Temperate effects on vegetation growth. So i want a scatter diagram between two variable so i can say to research community by the statistical plot.
I have done this task suggestion by you Xander Bakker and @Neil Ayres.
Thank you very much.
- Mark as New
- Bookmark
- Subscribe
- Mute
- Subscribe to RSS Feed
- Permalink
Hi shouvik jha ,
Just to give an example of how you could combine the Neil Ayres suggestion with the snippet Dan Patterson posted earlier, using two raster from the data you attached earlier (2010 r001_NPP vs r005_NPP):
def main():
import arcpy
import os
import math
from matplotlib import pyplot as plt
ras1 = r'D:\Xander\GeoNet\MeanRasters\data\r001_NPP.TIF'
ras2 = r'D:\Xander\GeoNet\MeanRasters\data\r005_NPP.TIF'
fc_pnt = r'D:\Xander\GeoNet\MeanRasters\gdb\data.gdb\randompoints'
num_points = 1000
# minimum distance between points to avoid points in same pixel
min_dist = math.hypot(arcpy.Describe(ras1).meanCellHeight, arcpy.Describe(ras1).meanCellWidth)
# Create random points
ws, fc_name = os.path.split(fc_pnt)
arcpy.CreateRandomPoints_management(out_path=ws, out_name=fc_name,
constraining_extent=ras1,
number_of_points_or_field=num_points,
minimum_allowed_distance=min_dist)
# Extract Multi Values to Points
arcpy.CheckOutExtension("Spatial")
ws, ras1_name = os.path.split(ras1)
ws, ras2_name = os.path.split(ras2)
ras1_name = ras1_name.replace('.', '_')
ras2_name = ras2_name.replace('.', '_')
in_rasters = [[ras1, ras1_name], [ras2, ras2_name]]
arcpy.sa.ExtractMultiValuesToPoints(fc_pnt, in_rasters, "NONE")
arcpy.CheckInExtension("Spatial")
# create lists of values
xs = [r[0] for r in arcpy.da.SearchCursor(fc_pnt, (ras1_name)) if not r[0] is None]
ys = [r[0] for r in arcpy.da.SearchCursor(fc_pnt, (ras2_name)) if not r[0] is None]
# create plot
plt.scatter(xs, ys)
main_title ="Scatter plot of {0} vs {1}".format(ras1_name, ras2_name)
plt.title(main_title, loc='center')
plt.minorticks_on()
plt.show()
if __name__ == '__main__':
main()
Which yields this:
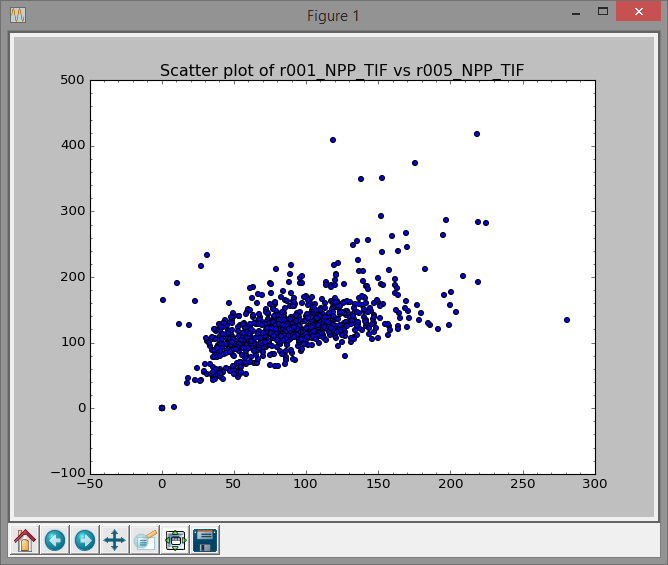
Below the point distribution in ArcGIS:

Grey points are filtered out for the graphic since they have NULL values.
- Mark as New
- Bookmark
- Subscribe
- Mute
- Subscribe to RSS Feed
- Permalink
Xander Bakker. Thank you. Excellent idea. Really its very helpful for research community.
I have created random points (Number of points:1000) using create random tool under feature class. and I have given that point feature class as fc_pnt path,

fc_pnt = r'D:\TEST\Reference_RASTER\Random_Points\Random_pnts.shp'i am getting error, might be i didn't construct fc_pnt data properly
Traceback (most recent call last):
File "<module1>", line 45, in <module>
File "<module1>", line 34, in main
RuntimeError: A column was specified that does not exist.Hope i have problem with my point feature data set. may i know how to construct that point feature class.
Thank you.
- Mark as New
- Bookmark
- Subscribe
- Mute
- Subscribe to RSS Feed
- Permalink
The parameters are convoluted, and I suspect that you didn't follow all of them since you specified a constraining extent and a total number of points.. did you do the dissolve? Did you try it without the optional parameters specified? see Create Random Points—Help | ArcGIS for Desktop
- Mark as New
- Bookmark
- Subscribe
- Mute
- Subscribe to RSS Feed
- Permalink
Dan Patterson. Thank you. Firstly i tried without dissolve, after read your comment i tried dissolve also, but problem still persist.
I just explaining short what i am doing,
Firstly i created random points using create random points tool----------> After i copied that Random points path directly from folder and use as "fc_pnt" path --------> Run the script
I have noticed, while running the program it is generating same point file in same location,
I have followed dissolve also after generating random points but same error i am getting.
- Mark as New
- Bookmark
- Subscribe
- Mute
- Subscribe to RSS Feed
- Permalink
To specify the inputs to the tool, just use the little envelope on the right of each input box and navigate to the data using that.
- Mark as New
- Bookmark
- Subscribe
- Mute
- Subscribe to RSS Feed
- Permalink
Neil, Thank you. Can you give one example ?
- Mark as New
- Bookmark
- Subscribe
- Mute
- Subscribe to RSS Feed
- Permalink
Hi shouvik jha ,
I had this type of error before too. Could you tell me the names of the rasters that you are using?
In my case I had this error since I used the name of the raster for the output fields. The problem was that the name "something.tif" was not valid as field name (renamed automagically by ArcGIS) resulting in trying to access a field name that does not exist. I "corrected" this in the code by replacing the dot for a underscore, buy obviously this would require something more elaborated to get a completely valid field name. Try and use ValidateTableName—Help | ArcGIS for Desktop for a more stable solution.