- Home
- :
- All Communities
- :
- Developers
- :
- Python
- :
- Python Questions
- :
- Is it possible to automate the interpolation of ti...
- Subscribe to RSS Feed
- Mark Topic as New
- Mark Topic as Read
- Float this Topic for Current User
- Bookmark
- Subscribe
- Mute
- Printer Friendly Page
Is it possible to automate the interpolation of time-enabled data (Time Slider Tool)?
- Mark as New
- Bookmark
- Subscribe
- Mute
- Subscribe to RSS Feed
- Permalink
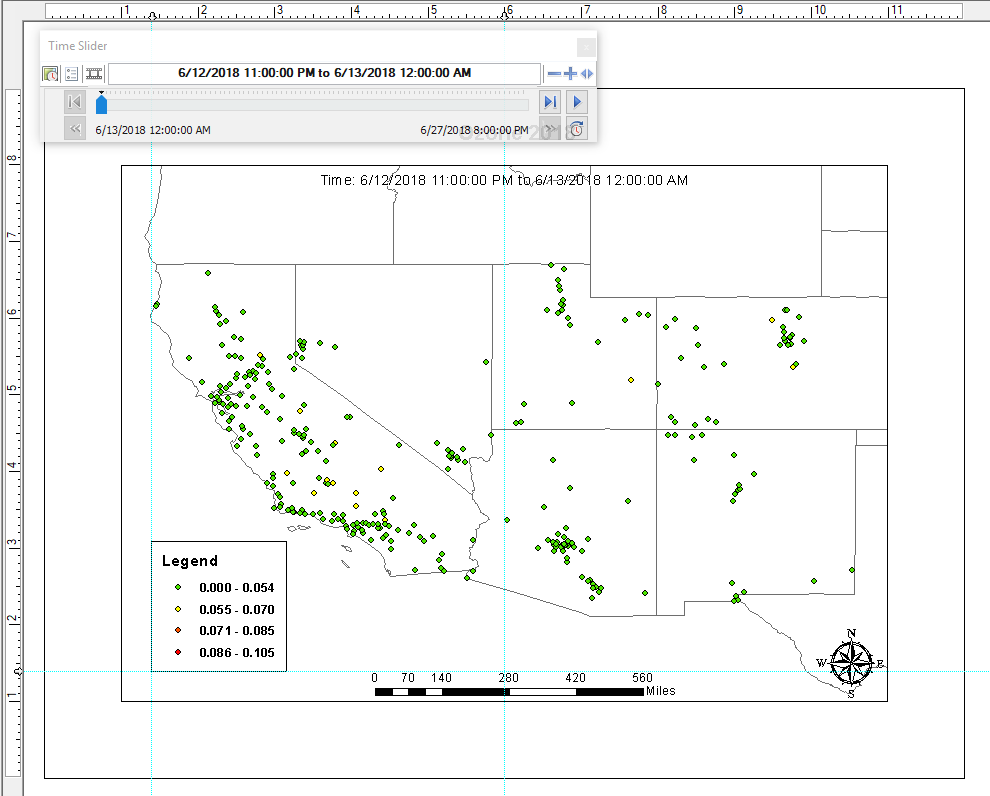
I have a point feature class of time-enabled ozone data for about 350 ozone monitor locations in the U.S. Southwest (see attached raw data sample, which only contains data for a few monitors). The ozone data consists of 4-hour averaged ozone concentrations (ppm) and spans the time period of 6/12/2018 12 PM to 6/27/2018 8 PM. Using the Time Slider Tool, I have set up the map display so that I can visualize the ozone data as it changes, using a time interval of 4 hours (see screenshot of the first time interval; the ozone point data has been symbolized with graduated colors).
My goal is to create interpolated maps of the ozone data for each time interval and then eventually export them into a folder. In an effort to automate the interpolation process, I created a python script (attached), employing the DataFrameTime object to control the progression of time. Note: I am using the EBK interpolation method.
When I run this script, two things happen: 1) The program exports maps of the ozone point data (i.e. the map layout), with each map showing ozone data for each time interval, and 2) the program produces and stores rasters of interpolated ozone data for ONLY the time interval currently showing in the map display. For example, if the while loop in the program went through 20 iterations, it would produce 20 rasters, but they'd all be the same, corresponding to the current time interval. So, it seems the program can successfully* cycle through the point data, but not successfully apply the EBK interpolation method for each time interval in the Time Slider Tool. Is there a solution to this? I did read somewhere that python didn't have full functionality with the Time Slider Tool yet, but that was in 2012.
*I use the word "successfully" hesitantly because I ran the script for another year and all the exported maps of the map layout were blank. That's another problem I am trying to figure out.
Thank you!
- Mark as New
- Bookmark
- Subscribe
- Mute
- Subscribe to RSS Feed
- Permalink
I figured out the secondary issue, that is, the note at the bottom regarding the blank maps. I had neglected to change the year values in the "d_start" and "d_end" variables when running the script again. So, that issue has been resolved.