- Home
- :
- All Communities
- :
- Developers
- :
- Python
- :
- Python Questions
- :
- Re: How to debug ArcGIS Pro (2.2.0) script tool u...
- Subscribe to RSS Feed
- Mark Topic as New
- Mark Topic as Read
- Float this Topic for Current User
- Bookmark
- Subscribe
- Mute
- Printer Friendly Page
How to debug ArcGIS Pro (2.2.0) script tool using Visual Studio 2017?
- Mark as New
- Bookmark
- Subscribe
- Mute
- Subscribe to RSS Feed
- Permalink
It is a reality that developers can use Visual Studio 2017 to interactively debug the script tools in ArcGIS Pro V2.2.0. This is clearly read and shown in the help document and the following video:
Debug Python code—ArcPy Get Started | ArcGIS Desktop
ArcGIS Pro and Python - YouTube
I spent many hours trying to make the Visual Studio 2017 debugger (Community Version) working with ArcGIS Pro without much success.
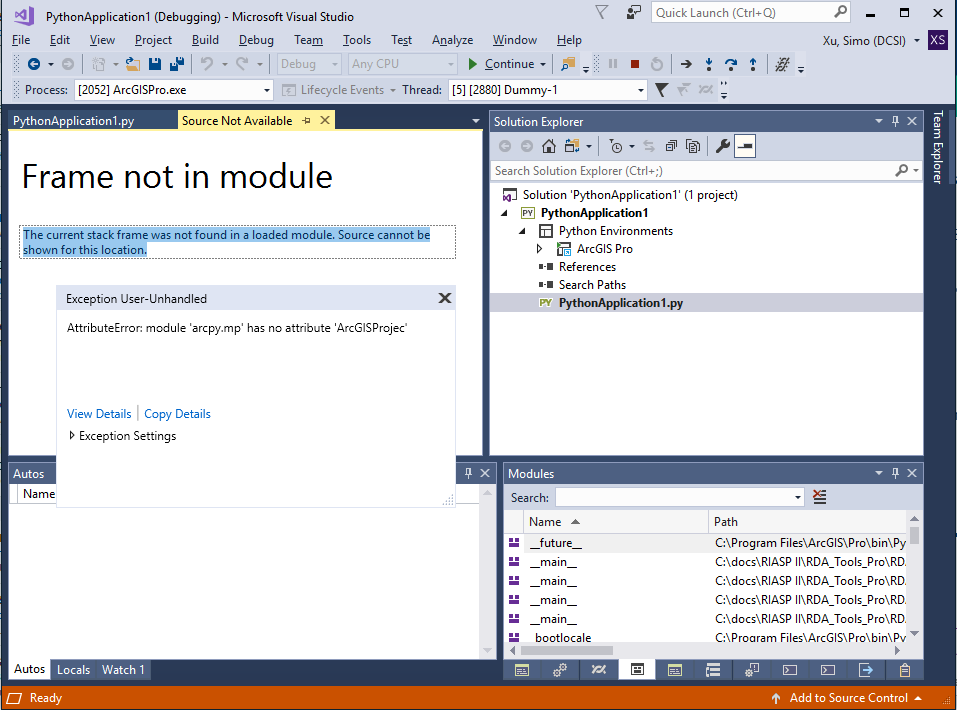
After I attached the debugger to the ArcGIS Pro process, I run the tool, then I 'll see the following error:
Source Not Available and Frame not in module:
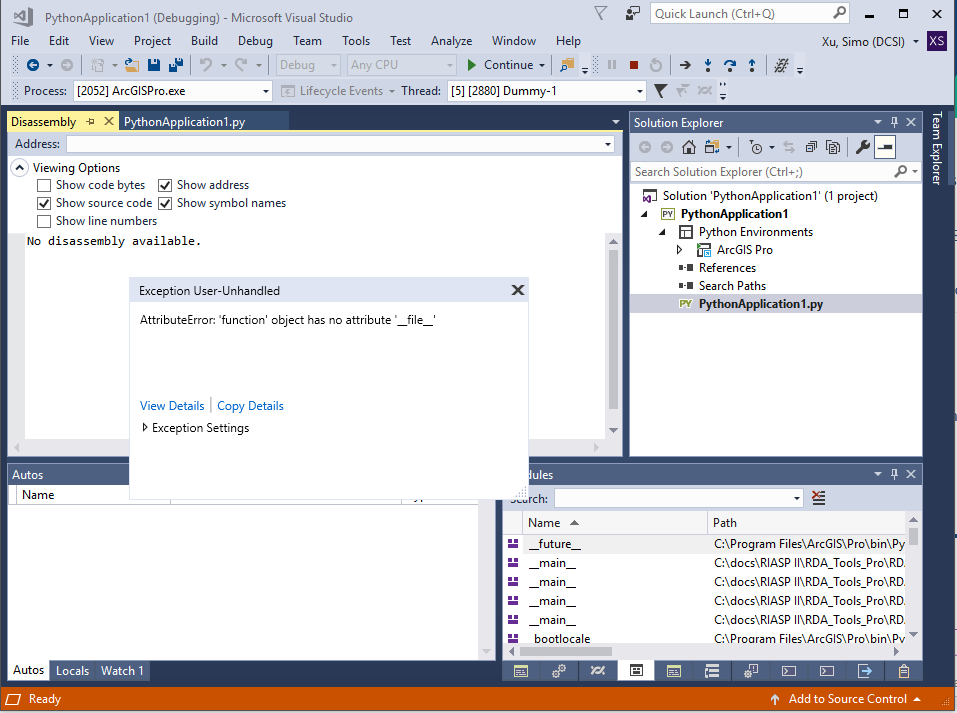
If I Enable address-level debugging--> Show disassembly if source is not available in the Debug-->Options
I'll the following error. To be honest, I don't think this setting make any sense for Python any way.
No disassembly available. (not surprised)
The way I set up the test:
1.Create a new python project in VS 2017.
2.Set the Python Environment to ArcGIS Pro env: C:\Program Files\ArcGIS\Pro\bin\Python\envs\arcgispro-py3
3.Put something testing code in the .py file in the project:
- aprx = arcpy.mp.ArcGISProject("C:\RIASP II\RDA_Pro\RDA_Pro.aprx")
- m=aprx.listMaps("Current Work Space")[0]
- for lyr in m.listLayers():
- if lyr.name=="Events":
- print(lyr.name)
4. create a script tool in ArcGIS Pro and point the script to the py file mentioned in step 3.
5. In VS 2017, Debug --> Attach to Process --> Attach to : Python Code --> ArcGIS Pro
6. Run the tool created in step 4 in ArcGIS Pro
If I check the Solution Property in VS 2017, I found my source code paths are automatically put into Do not look for these source files!!!

I tried to set the Directories containing source code in the above property window and empty the Do not look for these source files box before the debug, but, after the debug attempt my source code path will be put back in the Do not look for these source files.
Have anyone else tried this and actually made it working?
ESRI help document has not been very helpful to me so far..., Microsoft help document ? you know...
At least, we can see the light at the end of the tunnel: A rich debug experience in an IDE for script tools built for ArcGIS Pro is coming...
Any advice or suggestions will be highly appreciated.
Solved! Go to Solution.
Accepted Solutions
- Mark as New
- Bookmark
- Subscribe
- Mute
- Subscribe to RSS Feed
- Permalink
Hi Jonathan,
"Python Exception" actually is under Debug->Windows-->Exception Settings
In my post I said it was under Debug-->Options, that was wrong. sorry for that.
If you want to know more about the Python Exception in VS2017, here is a link:
Debug Python code - Visual Studio | Microsoft Docs
>>>> update:
I'll mark this as the correct answer for now, as it works for me. This can always be re-viewed and changed, when a better answer emerges. Thanks to all.
- Mark as New
- Bookmark
- Subscribe
- Mute
- Subscribe to RSS Feed
- Permalink
OK, Just an update.
It turns out you need to turn off the Python Exception, in the VS 2017 Debug--> Options. Then you'll be able to stop at the break point set in your source code.
I also installed Python native development tools for the Python development Workloads, but I don't know whether or not it has any effect on this outcome. Try turning off Python Exception first before installing this humongous component.
- Mark as New
- Bookmark
- Subscribe
- Mute
- Subscribe to RSS Feed
- Permalink
Hi simo xu,
What do you mean by "turn off the Python Exception"?
- Mark as New
- Bookmark
- Subscribe
- Mute
- Subscribe to RSS Feed
- Permalink
Hi Jonathan,
"Python Exception" actually is under Debug->Windows-->Exception Settings
In my post I said it was under Debug-->Options, that was wrong. sorry for that.
If you want to know more about the Python Exception in VS2017, here is a link:
Debug Python code - Visual Studio | Microsoft Docs
>>>> update:
I'll mark this as the correct answer for now, as it works for me. This can always be re-viewed and changed, when a better answer emerges. Thanks to all.
- Mark as New
- Bookmark
- Subscribe
- Mute
- Subscribe to RSS Feed
- Permalink
or have a look at...
/blogs/dan_patterson/2018/01/28/spyder
/blogs/dan_patterson/2016/07/17/anaconda-spyder-and-arcgis-pro
/blogs/dan_patterson/2017/07/01/arcgis-pro-2-creating-desktop-shortcuts
Although as of writing, there is an issue with ArcGIS Pro 2.2 and cloned environments... but when it is resolved, Spyder is a real option since it integrates well with IPython Jupyter Notebooks as well
- Mark as New
- Bookmark
- Subscribe
- Mute
- Subscribe to RSS Feed
- Permalink
@simo, pls have a good look at Debug Python code—ArcPy Get Started | ArcGIS Desktop
i just did these exact steps
1. Open Visual Studio 2017
2. install "Python development" workload
3. from the menu choose File\Open\File... , choose your py file, and add a break point
4. from the menu choose Debug\Attach to Process...
- Attach to: must be set to Python code.
- in the Available processes list, choose ArcGISPro.exe
- Mark as New
- Bookmark
- Subscribe
- Mute
- Subscribe to RSS Feed
- Permalink
Thanks Ghislain.
I managed to make it working as I mentioned in the update, but the whole environment is still a little shaky.
When I try to step through the script tool validation code, there is a big chance VS 2017 can't find the source code, then
the Open Source window will be opened tryinig to find a file type of something like RDA_Tools_Pro\RDA Data Management.tbx#updateEventIDs.UpdateParameters.py :
If I don't use step over mode, it seems working fine, it can hit the breakpoint and I can inspect the variable values. then I can set breakpoint at another location and use Continue command to run the program and make it stop at the breakpoint.
It's not perfect, but I have to say it's much better than nothing 🙂
- Mark as New
- Bookmark
- Subscribe
- Mute
- Subscribe to RSS Feed
- Permalink
For debugging to work correctly the IDE requires the code to live in a ".py" file on disk.
Since script tool validation code doesn't live inside a ".py" file (it lives inside the .tbx) , so you cannot debug it as is. See the instructions found in the "Debug script tool validation code" on the help page i mentioned above.
Cheers
- Mark as New
- Bookmark
- Subscribe
- Mute
- Subscribe to RSS Feed
- Permalink
Thanks
As said, I can set breakpoints and it sometimes works, kind of hit-and-miss though. so the process you mentioned is done ---- copying the code to a py file and in the tool validation dialog I have some code to load the validation module.
- Mark as New
- Bookmark
- Subscribe
- Mute
- Subscribe to RSS Feed
- Permalink
referencing this in case this helps anyone: