- Home
- :
- All Communities
- :
- Developers
- :
- Python
- :
- Python Questions
- :
- How to calculate the percentile for each cell from...
- Subscribe to RSS Feed
- Mark Topic as New
- Mark Topic as Read
- Float this Topic for Current User
- Bookmark
- Subscribe
- Mute
- Printer Friendly Page
How to calculate the percentile for each cell from timeseries raster
- Mark as New
- Bookmark
- Subscribe
- Mute
- Subscribe to RSS Feed
- Permalink
Branched from: https://community.esri.com/thread/95403
Hi Xander Bakker thank you for above script. I have tested and it works using my data.
But I have question. Let say I have timeseries raster data from 1981 to 2016, its the max of daily rainfall in a year, so its just 1 raster data for 1 year. For each cell in x,y location from 1981 to 2016, I would like to calculate the percentile of i.e 90%.
How to calculate the percentile for each cell from timeseries raster using your script?
Solved! Go to Solution.
- Mark as New
- Bookmark
- Subscribe
- Mute
- Subscribe to RSS Feed
- Permalink
Define Projection.... as per usual in the Data Management tools, Projections and Transformations
- Mark as New
- Bookmark
- Subscribe
- Mute
- Subscribe to RSS Feed
- Permalink
Thank you Dan, finally I managed to add the spatial ref.
I added info on line 23-27 to line 30
out = arcpy.NumPyArrayToRaster(n_90, arcpy.Point(114.4317366,-8.8492618), x_cell_size=0.049242234706753, y_cell_size=0.049242234706753, value_to_nodata=0)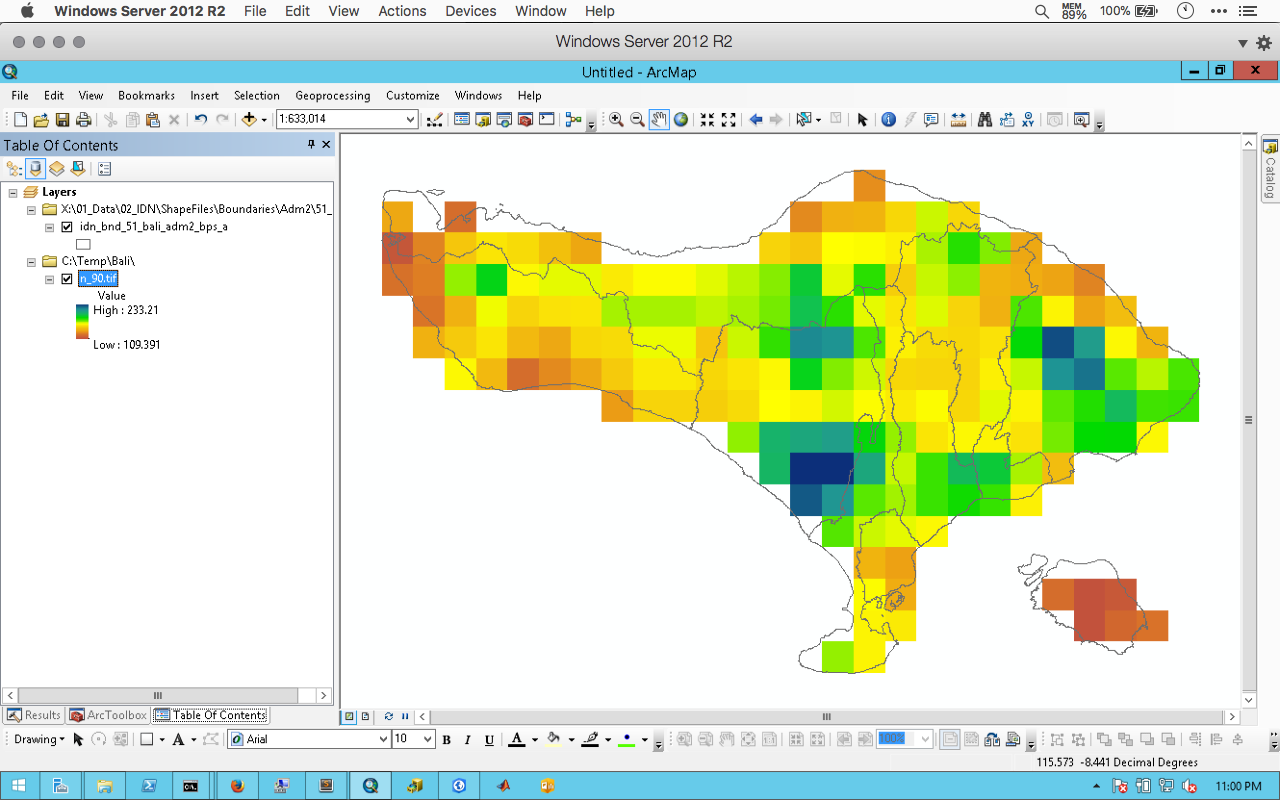
- Mark as New
- Bookmark
- Subscribe
- Mute
- Subscribe to RSS Feed
- Permalink
Ahhh that is what I was referring to in a previous post. That was the missing information when I originally ran it.
- « Previous
-
- 1
- 2
- Next »
- « Previous
-
- 1
- 2
- Next »