- Home
- :
- All Communities
- :
- Developers
- :
- Python
- :
- Python Questions
- :
- Re: Group Index Polygon Features to Reduce Overall...
- Subscribe to RSS Feed
- Mark Topic as New
- Mark Topic as Read
- Float this Topic for Current User
- Bookmark
- Subscribe
- Mute
- Printer Friendly Page
Group Index Polygon Features to Reduce Overall Raster Extent
- Mark as New
- Bookmark
- Subscribe
- Mute
- Subscribe to RSS Feed
- Permalink
I have created a index grid feature class that represents the tiles of images that I have for a project study area. What I'm looking to do, is mosaic the raster tiles into a suitable number of tile groups that will reduce the Raster extent of the overall Raster study area extent to reduce the amount of NoData and overall image size. At first thought the problem to solve is the number of tiles to generate that will optimally reduce the overall raster extent thereby reducing the NoData and overall image size.
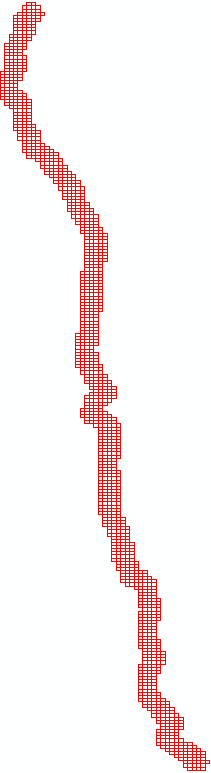
Index Grid Polygon Feature Class
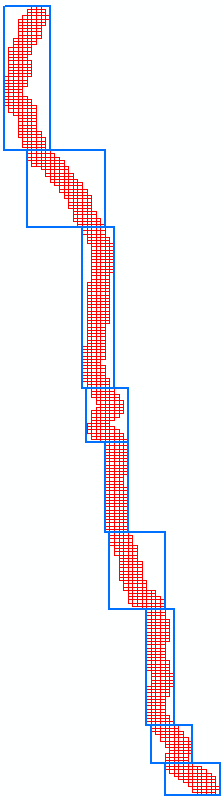
Index Grid Groups
I've attached the Index Grid Shapefile. Any advice in possible methods that I could apply to determine the most optimal groupings to reduce the NoData and overall Image Size. How the find the balance between the number of tile groups and overall image size.
Solved! Go to Solution.
Accepted Solutions
- Mark as New
- Bookmark
- Subscribe
- Mute
- Subscribe to RSS Feed
- Permalink
OK, this is the result of what I came up with:
It will certainly not be the best solution, since not all solutions are being evaluated. What it does is the following:
- it creates a dictionary with the group numbers as key and a list of minimum column number, maximum column number and height (number of rows in group)
- lines 12 to 31 was to determine the nodata percentage if all the polygons are merged into 1 (this could be ignored)
- line 33 to 37 contain some settings that will be used for the loop. In this case I defined that the minimum group size could be 10 groups and the maximum size will be 50
- the loop the starts at line 45 will try to create chunks off groups the have the lowest nodata percentage. What can be expected is that the smaller the group size the lower the percentage. Perhaps here an enhancement is necessary that weights the size (the bigger the better)
- the solutions that are being created will store the start group and end group that will be merged.
- I have manually grouped the polygons (but this could easily be done with code) and to create the envelopes I used the minimum bounding geometry tool.
- the list of solutions does not contain the last group, but I just grouped the last polygons together into 1 group and it "almost makes sense".
def main():
import arcpy
fc = r'C:\GeoNet\GridGroup\gdb\data.gdb\index_diss_sort_group01'
fld_min = 'MIN_MIN_Numbr'
fld_max = 'MAX_MAX_Numbr'
fld_grp = 'grp01'
flds = (fld_grp, fld_min, fld_max, 'SHAPE@')
dct = {r[0]: [r[1], r[2], int(r[3].extent.height / 0.00893373030740463)] for r in arcpy.da.SearchCursor(fc, flds)}
min_col = 999
max_col = 0
rows = 0
cnt_cols = 0
for group, info in sorted(dct.items()):
# print group, info
col_from = info[0]
col_to = info[1]
height = info[2]
rows += height
cols = (col_to - col_from + 1) * height
cnt_cols += cols
if col_from < min_col:
min_col = col_from
if col_to > max_col:
max_col = col_to
cols = max_col - min_col + 1
space = rows * cols
nodata = space - cnt_cols
min_group = min(dct.keys())
max_group = max(dct.keys())
in_groups = max_group - min_group + 1
min_group_size = 10
max_group_size = 50
out_groups = 4
solutions = []
best_solution = []
prev_group = 0
start_group = 1
end_group = 0
while prev_group + min_group_size < max_group:
best_percentage = 100
for end_group in range(prev_group + min_group_size + 1, prev_group + max_group_size + 1):
# print "\n", start_group, end_group
if end_group <= max_group:
cols, rows, space, nodata, nodata_perc = GetChunkStats(start_group, end_group, dct)
# print rows, cols, space
# print cnt_cols
# print nodata
# print start_group, end_group, round(nodata_perc, 3), "%"
if nodata_perc < best_percentage:
best_percentage = nodata_perc
best_solution = [start_group, end_group]
print
print best_percentage
print best_solution
solutions.append(best_solution)
prev_group = best_solution[1]
start_group = prev_group + 1
print
for solution in solutions:
print solution
def GetChunkStats(from_group, to_group, dct):
# create sub group
dct_sub = {}
for group in range(from_group, to_group + 1):
dct_sub[group] = dct[group]
# generate stats for sub group
min_col = 999
max_col = 0
rows = 0
cnt_cols = 0
for group, info in sorted(dct_sub.items()):
# print group, info
col_from = info[0]
col_to = info[1]
height = info[2]
rows += height
cols = (col_to - col_from + 1) * height
cnt_cols += cols
if col_from < min_col:
min_col = col_from
if col_to > max_col:
max_col = col_to
cols = max_col - min_col + 1
space = rows * cols
nodata = space - cnt_cols
nodata_perc = float(nodata) * 100.0 / float(space)
return cols, rows, space, nodata, nodata_perc
if __name__ == '__main__':
main()
This is printed out:
51.1764705882
[1, 16]
57.0175438596
[17, 27]
51.9480519481
[28, 38]
40.0462962963
[39, 53]
26.7857142857
[54, 66]
59.0136054422
[67, 77]
46.2962962963
[78, 88]
49.3103448276
[89, 101]
[1, 16]
[17, 27]
[28, 38]
[39, 53]
[54, 66]
[67, 77]
[78, 88]
[89, 101]Surely, playing with the min_group_size setting will create different results (more or less groups).
- Mark as New
- Bookmark
- Subscribe
- Mute
- Subscribe to RSS Feed
- Permalink
Peter, ... I am assuming that you don't want any rotation involved. You have two conflicting/competing problems, the reduction in the number of index grids against the nodata area. My first inclination would be to go with a finer index division in those current blocks to reduce the nodata. For example, second block from the top that orients in the NW/SE direction. I would chop the NS extent into smaller chunks into 4-5 groupings which would thereby have a much smaller EW extent per block, and hence way less nodata cells. You may have to calculate your nodata areas for one configuration, then recalculate with another one. To optimize this to it best would be the extreme of 1 row per grouping... you would have no, nodata at that extreme. I would suggest trying a couple of qualitative configurations and graph groupings vs nodata area until you reach a comfortable compromise.
- Mark as New
- Bookmark
- Subscribe
- Mute
- Subscribe to RSS Feed
- Permalink
Hi Dan
Thanks for the advice, I'll have look graph groupings let you know what I finally use to solve the following. 
- Mark as New
- Bookmark
- Subscribe
- Mute
- Subscribe to RSS Feed
- Permalink
Is it your goal to mosaic the "parts" to new rasters or will you be handling the entire zone as a mosaic dataset? When you manage the entire area as 1 raster mosaic dataset you do not have to worry about cutting your study area into smaller parts.
- Mark as New
- Bookmark
- Subscribe
- Mute
- Subscribe to RSS Feed
- Permalink
Hi Xander
I'm looking to mosaic the smaller areas, as you mentioned the following wouldn't be a problem if I mosaiced the tiles into a single image. The group mosaic's are a lot smaller in file such and easier to load within the AutoCAD software.
- Mark as New
- Bookmark
- Subscribe
- Mute
- Subscribe to RSS Feed
- Permalink
OK, so you will not be working this mosaic in ArcGIS but in CAD software. This raises another question.Will you be working with the imagery as a backdrop? In CAD it is quite common to work with predefined map sheets. If that is the case it wouldn't be wise to use extents that differ from those predefined extents. Also the example you included seem pretty optimal. In case this is a one time thing, I wouldn't bother to try and code the optimization. If this is something you will be doing more often it might be good to do.
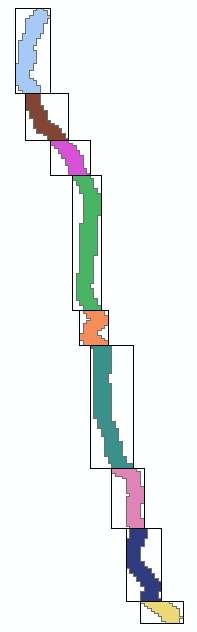
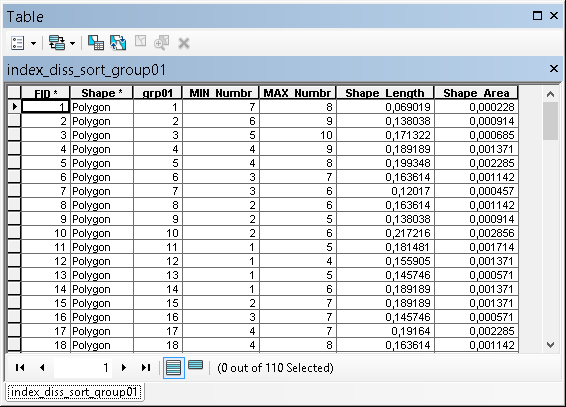
Looking at the data I notice you have a field with the PageName where the characters correspond to the rows and the numbers to the columns:
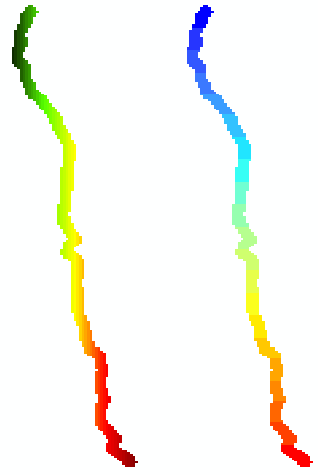
Since the orientation is North - South, the geometry could be reduced to rows and those row can be dissolved when they start and end at the same column number:
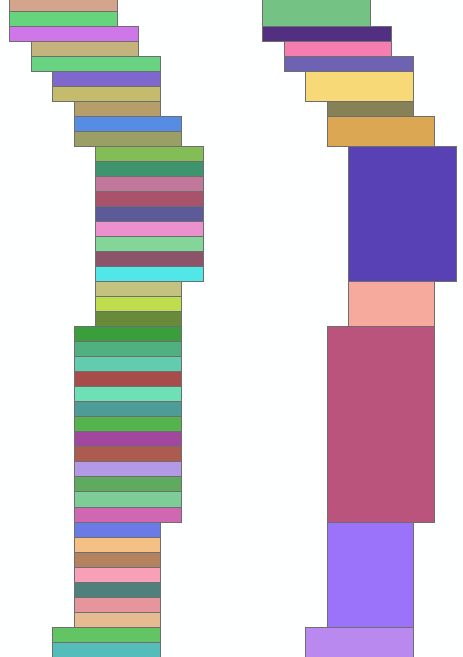
Code used for this step (featureclass was dissolved by row and sorted on geometry north to south and during the dissolve the minimum and maximum column number was calculated):
def main():
import arcpy
fc = r'C:\GeoNet\GridGroup\gdb\data.gdb\index_diss_sort'
fld_min = 'MIN_Numbr'
fld_max = 'MAX_Numbr'
fld_grp = 'grp01'
flds = ('OID@', fld_min, fld_max, fld_grp)
group = 0
with arcpy.da.UpdateCursor(fc, flds) as curs:
for row in curs:
oid = row[0]
col_min = row[1]
col_max = row[2]
if group == 0:
group += 1
else:
if col_max == col_max_prev and col_min == col_min_prev:
# group remains the same
pass
else:
group += 1
col_min_prev = col_min
col_max_prev = col_max
curs.updateRow((oid, col_min, col_max, group,))
if __name__ == '__main__':
main()
Dissolve on the field "grp01" and calculate the min of MIN_Numbr and max of MAX_Numbr. Now you have a featureclass with 110 polygons. The fields in this attribute table provide enough information to implement some sort of optimization where the minimum amount of NoData is obtained with a given number of output polygons and perhaps a minimum and maximum amount of rows setting applied in the process:
- Mark as New
- Bookmark
- Subscribe
- Mute
- Subscribe to RSS Feed
- Permalink
Hi Xander
Thanks for the solution, this will definitely work and the approach is clean and simple, not over complicated.
- Mark as New
- Bookmark
- Subscribe
- Mute
- Subscribe to RSS Feed
- Permalink
To be honest, this is just the first step in the process. It would be nice to explore the options a little more and have the output polygons generated by a script. I will see if I can give it a shot and will post back.
- Mark as New
- Bookmark
- Subscribe
- Mute
- Subscribe to RSS Feed
- Permalink
OK, this is the result of what I came up with:
It will certainly not be the best solution, since not all solutions are being evaluated. What it does is the following:
- it creates a dictionary with the group numbers as key and a list of minimum column number, maximum column number and height (number of rows in group)
- lines 12 to 31 was to determine the nodata percentage if all the polygons are merged into 1 (this could be ignored)
- line 33 to 37 contain some settings that will be used for the loop. In this case I defined that the minimum group size could be 10 groups and the maximum size will be 50
- the loop the starts at line 45 will try to create chunks off groups the have the lowest nodata percentage. What can be expected is that the smaller the group size the lower the percentage. Perhaps here an enhancement is necessary that weights the size (the bigger the better)
- the solutions that are being created will store the start group and end group that will be merged.
- I have manually grouped the polygons (but this could easily be done with code) and to create the envelopes I used the minimum bounding geometry tool.
- the list of solutions does not contain the last group, but I just grouped the last polygons together into 1 group and it "almost makes sense".
def main():
import arcpy
fc = r'C:\GeoNet\GridGroup\gdb\data.gdb\index_diss_sort_group01'
fld_min = 'MIN_MIN_Numbr'
fld_max = 'MAX_MAX_Numbr'
fld_grp = 'grp01'
flds = (fld_grp, fld_min, fld_max, 'SHAPE@')
dct = {r[0]: [r[1], r[2], int(r[3].extent.height / 0.00893373030740463)] for r in arcpy.da.SearchCursor(fc, flds)}
min_col = 999
max_col = 0
rows = 0
cnt_cols = 0
for group, info in sorted(dct.items()):
# print group, info
col_from = info[0]
col_to = info[1]
height = info[2]
rows += height
cols = (col_to - col_from + 1) * height
cnt_cols += cols
if col_from < min_col:
min_col = col_from
if col_to > max_col:
max_col = col_to
cols = max_col - min_col + 1
space = rows * cols
nodata = space - cnt_cols
min_group = min(dct.keys())
max_group = max(dct.keys())
in_groups = max_group - min_group + 1
min_group_size = 10
max_group_size = 50
out_groups = 4
solutions = []
best_solution = []
prev_group = 0
start_group = 1
end_group = 0
while prev_group + min_group_size < max_group:
best_percentage = 100
for end_group in range(prev_group + min_group_size + 1, prev_group + max_group_size + 1):
# print "\n", start_group, end_group
if end_group <= max_group:
cols, rows, space, nodata, nodata_perc = GetChunkStats(start_group, end_group, dct)
# print rows, cols, space
# print cnt_cols
# print nodata
# print start_group, end_group, round(nodata_perc, 3), "%"
if nodata_perc < best_percentage:
best_percentage = nodata_perc
best_solution = [start_group, end_group]
print
print best_percentage
print best_solution
solutions.append(best_solution)
prev_group = best_solution[1]
start_group = prev_group + 1
print
for solution in solutions:
print solution
def GetChunkStats(from_group, to_group, dct):
# create sub group
dct_sub = {}
for group in range(from_group, to_group + 1):
dct_sub[group] = dct[group]
# generate stats for sub group
min_col = 999
max_col = 0
rows = 0
cnt_cols = 0
for group, info in sorted(dct_sub.items()):
# print group, info
col_from = info[0]
col_to = info[1]
height = info[2]
rows += height
cols = (col_to - col_from + 1) * height
cnt_cols += cols
if col_from < min_col:
min_col = col_from
if col_to > max_col:
max_col = col_to
cols = max_col - min_col + 1
space = rows * cols
nodata = space - cnt_cols
nodata_perc = float(nodata) * 100.0 / float(space)
return cols, rows, space, nodata, nodata_perc
if __name__ == '__main__':
main()
This is printed out:
51.1764705882
[1, 16]
57.0175438596
[17, 27]
51.9480519481
[28, 38]
40.0462962963
[39, 53]
26.7857142857
[54, 66]
59.0136054422
[67, 77]
46.2962962963
[78, 88]
49.3103448276
[89, 101]
[1, 16]
[17, 27]
[28, 38]
[39, 53]
[54, 66]
[67, 77]
[78, 88]
[89, 101]Surely, playing with the min_group_size setting will create different results (more or less groups).