- Home
- :
- All Communities
- :
- Developers
- :
- Python
- :
- Python Questions
- :
- Convert Summary Table Structure (Using Python)
- Subscribe to RSS Feed
- Mark Topic as New
- Mark Topic as Read
- Float this Topic for Current User
- Bookmark
- Subscribe
- Mute
- Printer Friendly Page
Convert Summary Table Structure (Using Python)
- Mark as New
- Bookmark
- Subscribe
- Mute
- Subscribe to RSS Feed
- Permalink
I originally posted the question under the following post: Python solution to convert single column into multiple columns but its seems I didn't explain clearly what I'm trying to achieve. I hope the following is a lot clearer as I desperately need to solve the following as I have few hundred table to process.
I have generated summary statistics tables based on the results of an intersection. The summary statistics table format is as per below:
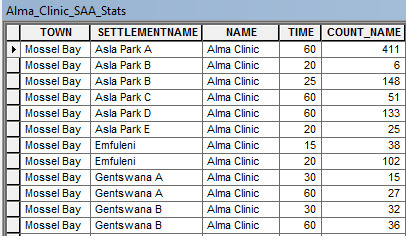
if you look at the following table as an example:
- Mossel Bay, Asla Park B, Alma Clinic appears twice as there 6 buildings found within 20 minutes and 148 buildings within 25 minutes.
I need to convert the table structure so that there is one entry for:
- Mossel Bay, Also Park B, Alma Clinic with the TIME field being split per interval (i.e. 5min, 10min - 60min) with the number of buildings (COUNT_NAME) being populated within the appropriate fields as per below:
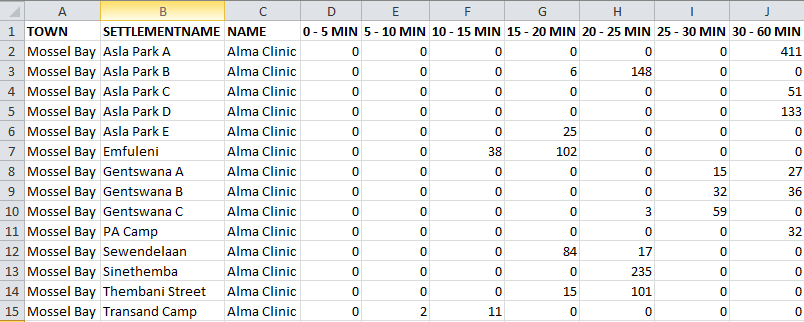
As you can see from the example above Mossel Bay, Asla Park B, Alma Clinic has a single row and the Number of buildings have been populated within the appropriate fields per time interval.
I've tried using ArcPy Data Access Module with no success as the rows are not unique so insert cursor wont work, can't use the update cursor as I'm trying to populate an empty table.
I was considering numpy, but would need some advice on how to get started and also considered python dictionaries and also realised my knowledge is limited at this stage. Any advice to solve the following would be appreciated.
- Mark as New
- Bookmark
- Subscribe
- Mute
- Subscribe to RSS Feed
- Permalink
What about the Pivot Tool, it is designed for "reducing redundancy in records and flattening one-to-many relationships." That said, it will not fill in all of the empty columns like you want because that data doesn't exist in your summary statistics. One way around that issue is to add additional 0 count records for all of the time ranges you are interested in.
- Mark as New
- Bookmark
- Subscribe
- Mute
- Subscribe to RSS Feed
- Permalink
Hi Joshua,
Thanks for the following suggestion. This would have gotten be a lot closer to what I was looking for. Unfortunately I only have a Standard Licence.
- Mark as New
- Bookmark
- Subscribe
- Mute
- Subscribe to RSS Feed
- Permalink
Why dump the data to Excel, classify each row, and run a Pivot table?
- Mark as New
- Bookmark
- Subscribe
- Mute
- Subscribe to RSS Feed
- Permalink
some of the work has gone off-line and I will report later.
Suffice to say reshuffling preprocess data is fairly easy, but it would be useful to run the reclassification and summary for more than one facility in more than one time into a preset series of time classes. A more generic example with 24 combinations of County-Town-facility for 100,000 unique origin-destination (aka trips to a facility from a location) can be done quickly (N=100,000 1.914e-01 sec. to process). The nice thing, is if one wants to collapse the level of anything, it only gets faster. You can collapse to the County-town level by consolidating all facilities, you can even collapse that further to the County level. Alternately, changing the bins (currently bins = [0, 5, 10, 15, 20, 25, 30, 60] ) is easy and the raw data can be re-binned (digizited) using an infinite number of classification schemes.
I will be posting my results even if Peter choses not to use the methodology. It is important though to scope the more general case and simplify to the specific should time be a constraint.
- Mark as New
- Bookmark
- Subscribe
- Mute
- Subscribe to RSS Feed
- Permalink
Peter.. could you post your example in some easily read form for experimentation so retyping isn't needed
- Mark as New
- Bookmark
- Subscribe
- Mute
- Subscribe to RSS Feed
- Permalink
got it... I will have a look
- Mark as New
- Bookmark
- Subscribe
- Mute
- Subscribe to RSS Feed
- Permalink
There's probably a fancier, more streamlined way to get to this, but here's one way to get your data ready for an insertCursor. You'll still have to create a feature class and add the appropriate fields:
>>> times = set([])
... with arcpy.da.SearchCursor("Alma_Clinic_SAA_Stats$","TIME") as cursor:
...    for row in cursor:
...        times.add(row[0]) # get a unique list of possible times
... time_dict = {}
... for i,item in enumerate(sorted(times)):
...    time_dict[item] = i + 3 # make a dictionary, with index number to fit in final table: {time1:3, time2:4, time5:5}
... dict = {}
... with arcpy.da.SearchCursor("Alma_Clinic_SAA_Stats$","*") as cursor:
...    for row in cursor:
...        dict.setdefault(row[0]+'-'+row[1],[row[0],row[1],row[2]] + ([0]*len(time_dict))) # make a default value: {key1:[TOWN,SETTLEMENT,NAME,0,0,0,0,0,0,0,0,0,etc.], key2...}
...        dict[row[0]+'-'+row[1]][time_dict[row[3]]] = row[4] # fill in BUILDINGS at appropriate places in list
... final_rows = []
... for k,v in dict.iteritems():
...    final_rows.append(v) # write out the final list, ready for insertCursor
... print final_rows
...
[[u'Mossel Bay', u'Asla Park C', u'Alma Clinic', 0, 0, 0, 0, 0, 51.0], [u'Mossel Bay', u'Asla Park B', u'Alma Clinic', 0, 0, 6.0, 148.0, 0, 0], [u'Mossel Bay', u'Asla Park A', u'Alma Clinic', 0, 0, 0, 0, 0, 411.0], [u'Mossel Bay', u'Sinethemba', u'Alma Clinic', 0, 0, 50.0, 235.0, 0, 0], [u'Mossel Bay', u'Asla Park E', u'Alma Clinic', 0, 0, 25.0, 0, 0, 0], [u'Mossel Bay', u'Asla Park D', u'Alma Clinic', 0, 0, 0, 0, 0, 133.0], [u'Mossel Bay', u'PA Camp', u'Alma Clinic', 0, 0, 0, 0, 0, 32.0], [u'Mossel Bay', u'Emfuleni', u'Alma Clinic', 0, 38.0, 102.0, 0, 0, 0], [u'Mossel Bay', u'Gentswana B', u'Alma Clinic', 0, 0, 0, 0, 32.0, 36.0], [u'Mossel Bay', u'Gentswana C', u'Alma Clinic', 0, 0, 0, 3.0, 59.0, 0], [u'Mossel Bay', u'Gentswana A', u'Alma Clinic', 0, 0, 0, 0, 15.0, 27.0], [u'Mossel Bay', u'Sewendelaan', u'Alma Clinic', 0, 0, 84.0, 17.0, 0, 0], [u'Mossel Bay', u'Transand Camp', u'Alma Clinic', 2.0, 11.0, 0, 0, 0, 0], [u'Mossel Bay', u'Thembani Street', u'Alma Clinic', 0, 0, 15.0, 101.0, 0, 0]]
- Mark as New
- Bookmark
- Subscribe
- Mute
- Subscribe to RSS Feed
- Permalink
Hi Darren
Thanks for the following looks great. I'm going to work on the following over the weekend. I'll post my final code on Monday for anyone else to use as a starting point, trying to achieve a similar result.