- Home
- :
- All Communities
- :
- Developers
- :
- Python
- :
- Python Questions
- :
- Re: CONSECUTIVE VALUES IN A SET OF RASTERS
- Subscribe to RSS Feed
- Mark Topic as New
- Mark Topic as Read
- Float this Topic for Current User
- Bookmark
- Subscribe
- Mute
- Printer Friendly Page
- Mark as New
- Bookmark
- Subscribe
- Mute
- Subscribe to RSS Feed
- Permalink
I'm running ArcGIS 10.2.1 Advanced with SA and Python 2.7
I'm trying to replicate in Python something done in excel:
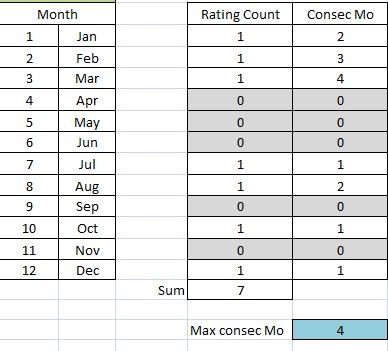
I have a set of 12 rasters with values 0 and 1, each raster representing a month of the year. I need to create an output raster that will count the maximum number of consecutive months occurring. In the excel example above the result is 4 as it starts in December and accumulates through until March. So it is looping through all months.
I have the column called "Rating Count" above sorted. The problem I encounter is with Jan in the "Consec Mo" column as this value is not fixed because it is fed from the December value in the same column.
I have tried this:
# Set monthly values to 0 and 1


jan = Con(IsNull(Rating_jan), 0, 1)
feb = Con(IsNull(Rating_feb), 0, 1)
mar = Con(IsNull(Rating_mar), 0, 1)
apr = Con(IsNull(Rating_apr), 0, 1)
may = Con(IsNull(Rating_may), 0, 1)
jun = Con(IsNull(Rating_jun), 0, 1)
jul = Con(IsNull(Rating_jul), 0, 1)
aug = Con(IsNull(Rating_aug), 0, 1)
sep = Con(IsNull(Rating_sep), 0, 1)
oct = Con(IsNull(Rating_jan), 0, 1)
nov = Con(IsNull(Rating_jan), 0, 1)
dec = Con(IsNull(Rating_jan), 0, 1)


# Calculate consecutive and MAX value


jan1 = jan
feb2 = Con((feb) == 1, (jan1) + 1, 0)
mar3 = Con((mar) == 1, (feb2) + 1, 0)
apr4 = Con((apr) == 1, (mar3) + 1, 0)
may5 = Con((may) == 1, (apr4) + 1, 0)
jun6 = Con((jun) == 1, (may5) + 1, 0)
jul7 = Con((jul) == 1, (jun6) + 1, 0)
aug8 = Con((aug) == 1, (jul7) + 1, 0)
sep9 = Con((sep) == 1, (aug8) + 1, 0)
oct10 = Con((oct) == 1, (sep9) + 1, 0)
nov11 = Con((nov) == 1, (oct10) + 1, 0)
dec12 = Con((dec) == 1, (nov11) + 1, 0)


Final_Output = CellStatistics([(jan1), (feb2), (mar3), (apr4), (may5), (jun6), (jul7), (aug8), (sep9), (oct10), (nov11), (dec12)]
, "MAXIMUM", "NODATA")


Final_Output.save(OUTWorkspace + "\\" + "Final_Output")
But as I said the "jan" value (row 23) is not fixed as in the script so it is not quite what I'm after.
I wonder if someone could give me some hints about how to solve this issue.
Thanks in advanced
Tony
Solved! Go to Solution.
Accepted Solutions
- Mark as New
- Bookmark
- Subscribe
- Mute
- Subscribe to RSS Feed
- Permalink
I posted a numpy arcpy example on sequences on my blog
If the data can be brought out into tabular form then this example may help. You can use RasterToNumpyArray to get rasters to arrays or TableToNumPyArray to get tabular data into array format.
- Mark as New
- Bookmark
- Subscribe
- Mute
- Subscribe to RSS Feed
- Permalink
Sorry bit confused here.
I can see that Dec14, Jan15, Feb15, Mar15 are consecutive.
But how do you know that Dec is the previous year and not 8 month later?
- Mark as New
- Bookmark
- Subscribe
- Mute
- Subscribe to RSS Feed
- Permalink
Thanks Neil. Sorry, I probably didn't explain myself properly.
I'm not dealing with years here; just months of any year. I need to calculate cumulative number of months that hold data (in this case value 1). The calculation should loop through the 12 months with no fixed starting point.
Hope it is a bit more clear now. Thanks again!
- Mark as New
- Bookmark
- Subscribe
- Mute
- Subscribe to RSS Feed
- Permalink
That any consecutive in a loop of 12 will be quite tricky.
- Mark as New
- Bookmark
- Subscribe
- Mute
- Subscribe to RSS Feed
- Permalink
If I understand correctly, rather than hard-coding month names into your variable names, I believe you should try naming based on something like "number of months before now (or given date)". So, if you ran the code now (October) the value for September would be held in the variable "months_ago_1", August in "months_ago_2", etc. When you run the code in November, October would move into "months_ago_1" etc.
- Mark as New
- Bookmark
- Subscribe
- Mute
- Subscribe to RSS Feed
- Permalink
Thanks Neil/Darren,
Darren, WHEN running the code it is not relevant here. I'll try to graphically explain again:
I have a stack of 12 cells each one representing presence or absence of data (1/0) for 12 months.
I need to produce an output raster cell that tells me the maximum number of cumulative months with data.
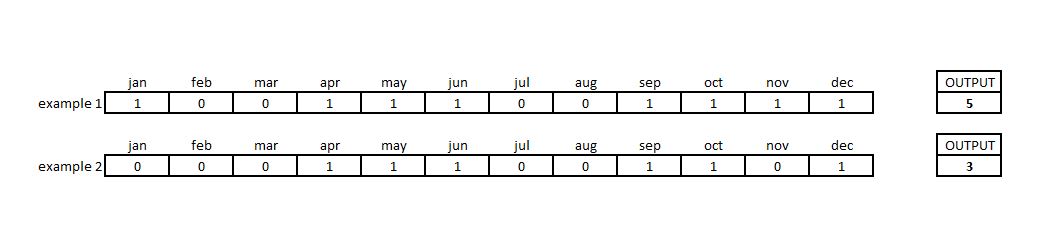
In example 1 above the output is 5 because there is data for sep, oct, nov, dec and jan
In example 2 above the output is 3 because there is data for apr, may and jun
Cheers
- Mark as New
- Bookmark
- Subscribe
- Mute
- Subscribe to RSS Feed
- Permalink
It is something that I have in excel but it seems not that straight forward to code in Python (or maybe it is...)
A function in python that calculates the "last occurrence"; in this case the last occurrence of 0 so it can start counting from there, I guess it would do the job. However, I cannot find in the documentation anything related to that.
- Mark as New
- Bookmark
- Subscribe
- Mute
- Subscribe to RSS Feed
- Permalink
I see. I think you can basically use your existing code, wrapping around the year one more time to pick up the dec->jan connection. Then, use the second "year" of rasters to get the max.
jan1 = jan
feb2 = Con((feb) == 1, (jan1) + 1, 0)
mar3 = Con((mar) == 1, (feb2) + 1, 0)
apr4 = Con((apr) == 1, (mar3) + 1, 0)
may5 = Con((may) == 1, (apr4) + 1, 0)
jun6 = Con((jun) == 1, (may5) + 1, 0)
jul7 = Con((jul) == 1, (jun6) + 1, 0)
aug8 = Con((aug) == 1, (jul7) + 1, 0)
sep9 = Con((sep) == 1, (aug8) + 1, 0)
oct10 = Con((oct) == 1, (sep9) + 1, 0)
nov11 = Con((nov) == 1, (oct10) + 1, 0)
dec12 = Con((dec) == 1, (nov11) + 1, 0)

# wrap back around
jan1_2 = Con((jan) == 1, (dec12) + 1, 0)
feb2_2 = Con((feb) == 1, (jan1_2) + 1, 0)
mar3_2 = Con((mar) == 1, (feb2_2) + 1, 0)
apr4_2 = Con((apr) == 1, (mar3_2) + 1, 0)
may5_2 = Con((may) == 1, (apr4_2) + 1, 0)
jun6_2 = Con((jun) == 1, (may5_2) + 1, 0)
jul7_2 = Con((jul) == 1, (jun6_2) + 1, 0)
aug8_2 = Con((aug) == 1, (jul7_2) + 1, 0)
sep9_2 = Con((sep) == 1, (aug8_2) + 1, 0)
oct10_2 = Con((oct) == 1, (sep9_2) + 1, 0)
nov11_2 = Con((nov) == 1, (oct10_2) + 1, 0)
dec12_2 = Con((dec) == 1, (nov11_2) + 1, 0)
Final_Output = CellStatistics([(jan1_2), (feb2_2), (mar3_2), (apr4_2), (may5_2), (jun6_2), (jul7_2), (aug8_2), (sep9_2), (oct10_2), (nov11_2), (dec12_2)] , "MAXIMUM", "NODATA")
- Mark as New
- Bookmark
- Subscribe
- Mute
- Subscribe to RSS Feed
- Permalink
Thanks Darren,
That works nicely.
The only thing is that the Max value you get is 24 so that needs to be set back to 12 in the final output.
Other than that, that's good.
Thanks again
Tony
- Mark as New
- Bookmark
- Subscribe
- Mute
- Subscribe to RSS Feed
- Permalink
Speaking of elegant, Darren, we can do better than that. 0 is false and anything else is true so:
jan1 = jan
feb2 = Con(feb, jan1 + 1, 0)
mar3 = Con(mar, feb2 + 1, 0)
apr4 = Con(apr, mar3 + 1, 0)
may5 = Con(may, apr4 + 1, 0)
jun6 = Con(jun, may5 + 1, 0)
jul7 = Con(jul, jun6 + 1, 0)
aug8 = Con(aug, jul7 + 1, 0)
sep9 = Con(sep, aug8 + 1, 0)
oct10 = Con(oct, sep9 + 1, 0)
nov11 = Con(nov, oct10 + 1, 0)
dec12 = Con(dec, nov11 + 1, 0)

# wrap back around
jan1_2 = Con(jan, dec12 + 1, 0)
feb2_2 = Con(feb, jan1_2 + 1, 0)
mar3_2 = Con(mar, feb2_2 + 1, 0)
apr4_2 = Con(apr, mar3_2 + 1, 0)
may5_2 = Con(may, apr4_2 + 1, 0)
jun6_2 = Con(jun, may5_2 + 1, 0)
jul7_2 = Con(jul, jun6_2 + 1, 0)
aug8_2 = Con(aug, jul7_2 + 1, 0)
sep9_2 = Con(sep, aug8_2 + 1, 0)
oct10_2 = Con(oct, sep9_2 + 1, 0)
nov11_2 = Con(nov, oct10_2 + 1, 0)
dec12_2 = Con(dec, nov11_2 + 1, 0)
counts = CellStatistics(
    [jan1_2, feb2_2, mar3_2, apr4_2, may5_2, jun6_2,
    jul7_2, aug8_2, sep9_2, oct10_2, nov11_2, dec12_2],
  "MAXIMUM", "NODATA")
# "wraps" may give us more than 12 (actually 24 if no gaps)
final_raster = Con(counts > 12, 12, counts)
Note these are all local operators so with deferred raster calculations this may be extremely efficient, and you don't have to load all the rasters into numpy arrays - so this approach is more likely to be successful with large rasters.