- Home
- :
- All Communities
- :
- Developers
- :
- Python
- :
- Python Questions
- :
- Re: CONSECUTIVE VALUES IN A SET OF RASTERS
- Subscribe to RSS Feed
- Mark Topic as New
- Mark Topic as Read
- Float this Topic for Current User
- Bookmark
- Subscribe
- Mute
- Printer Friendly Page
- Mark as New
- Bookmark
- Subscribe
- Mute
- Subscribe to RSS Feed
- Permalink
I'm running ArcGIS 10.2.1 Advanced with SA and Python 2.7
I'm trying to replicate in Python something done in excel:
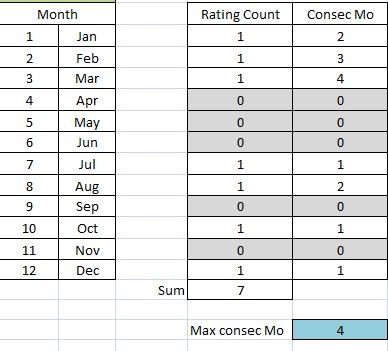
I have a set of 12 rasters with values 0 and 1, each raster representing a month of the year. I need to create an output raster that will count the maximum number of consecutive months occurring. In the excel example above the result is 4 as it starts in December and accumulates through until March. So it is looping through all months.
I have the column called "Rating Count" above sorted. The problem I encounter is with Jan in the "Consec Mo" column as this value is not fixed because it is fed from the December value in the same column.
I have tried this:
# Set monthly values to 0 and 1


jan = Con(IsNull(Rating_jan), 0, 1)
feb = Con(IsNull(Rating_feb), 0, 1)
mar = Con(IsNull(Rating_mar), 0, 1)
apr = Con(IsNull(Rating_apr), 0, 1)
may = Con(IsNull(Rating_may), 0, 1)
jun = Con(IsNull(Rating_jun), 0, 1)
jul = Con(IsNull(Rating_jul), 0, 1)
aug = Con(IsNull(Rating_aug), 0, 1)
sep = Con(IsNull(Rating_sep), 0, 1)
oct = Con(IsNull(Rating_jan), 0, 1)
nov = Con(IsNull(Rating_jan), 0, 1)
dec = Con(IsNull(Rating_jan), 0, 1)


# Calculate consecutive and MAX value


jan1 = jan
feb2 = Con((feb) == 1, (jan1) + 1, 0)
mar3 = Con((mar) == 1, (feb2) + 1, 0)
apr4 = Con((apr) == 1, (mar3) + 1, 0)
may5 = Con((may) == 1, (apr4) + 1, 0)
jun6 = Con((jun) == 1, (may5) + 1, 0)
jul7 = Con((jul) == 1, (jun6) + 1, 0)
aug8 = Con((aug) == 1, (jul7) + 1, 0)
sep9 = Con((sep) == 1, (aug8) + 1, 0)
oct10 = Con((oct) == 1, (sep9) + 1, 0)
nov11 = Con((nov) == 1, (oct10) + 1, 0)
dec12 = Con((dec) == 1, (nov11) + 1, 0)


Final_Output = CellStatistics([(jan1), (feb2), (mar3), (apr4), (may5), (jun6), (jul7), (aug8), (sep9), (oct10), (nov11), (dec12)]
, "MAXIMUM", "NODATA")


Final_Output.save(OUTWorkspace + "\\" + "Final_Output")
But as I said the "jan" value (row 23) is not fixed as in the script so it is not quite what I'm after.
I wonder if someone could give me some hints about how to solve this issue.
Thanks in advanced
Tony
Solved! Go to Solution.
- Mark as New
- Bookmark
- Subscribe
- Mute
- Subscribe to RSS Feed
- Permalink
Numpy format would be best
>>> #----------------------------------------
>>> data = [0,0,1,1,1,1,0,0,0,1,1,1,1,1,0,0,1,1,1,1]
>>> a = np.array(data,dtype=bool)  # boolean data
>>> chg = (a[:-1] ^ a[1:])        # change
>>> pos = np.arange(len(chg))[chg] # positions
>>> diff = np.diff(pos)            # differences
>>> max_seq = np.max(diff)        # max in sequences
>>>
>>> chg
array([False,  True, False, False, False,  True, False, False,  True,
      False, False, False, False,  True, False,  True, False, False, False], dtype=bool)
>>> pos
array([ 1,  5,  8, 13, 15])
>>> diff
array([4, 3, 5, 2])
>>> max_seq
5
I am sure it can also be done with cursors and other stuff, if you can't get your data into a numpy array using numpyarraytotable or similar
EDIT
to prevent wraparound you need to pad the array at the beginning and the end. It can be done int this fashion, in this example yielding the same result
>>> # to prevent wrap around sequence starts at zero
>>> an = np.hstack(([0],a,[0]))  # a is from above
>>> diff2 = np.diff(an)
>>> begin = np.where(diff2 > 0)
>>> end = np.where(diff2 < 0)
>>> # tuples are returned to get the 0th result
>>> end[0] - begin[0]
array([4, 5, 4], dtype=int64)
>>>
Arrays are powerful tools
- Mark as New
- Bookmark
- Subscribe
- Mute
- Subscribe to RSS Feed
- Permalink
I posted a numpy arcpy example on sequences on my blog
If the data can be brought out into tabular form then this example may help. You can use RasterToNumpyArray to get rasters to arrays or TableToNumPyArray to get tabular data into array format.
- Mark as New
- Bookmark
- Subscribe
- Mute
- Subscribe to RSS Feed
- Permalink
Thanks Darren,
That seems a very elegant way of doing it.
I'm trying to adapt your script to my set of 12 rasters using the RasterToNumpyArray.
Thanks again!
- Mark as New
- Bookmark
- Subscribe
- Mute
- Subscribe to RSS Feed
- Permalink
I will post a 3d example sometime this week. The only issue I have seen so far is array size vs memory. You may need to use an generator to pass your arrays in, instead of holding them in all at once.
- Mark as New
- Bookmark
- Subscribe
- Mute
- Subscribe to RSS Feed
- Permalink
(I meant "Thanks Dan" on my previous reply)
I'll keep an eye on your 3rd example.
Cheers
- Mark as New
- Bookmark
- Subscribe
- Mute
- Subscribe to RSS Feed
- Permalink
Busy now, will finish later... consider these huge binary arrays (aka 3x3) forming a time stack for a location. Just an idea, I will let you play with the other axes should you be interested in other differences. As indicated, it may be too much to load a large sequence in memory, but the whole process could be parsed. I took out some of the extra print lines between the tiles
>>> a
array([[0, 1, 0],
      [1, 1, 1],
      [0, 1, 0]])
>>> b
array([[1, 0, 1],
      [0, 0, 0],
      [1, 0, 1]])
>>> c
array([[  1,    0,  10],
      [  0,  100,    0],
      [1000,    0,    1]])
>>> stack
array([[[  0,    1,    0],
        [  1,    1,    1],
        [  0,    1,    0]],

      [[  0,    1,    0],
        [  1,    1,    1],
        [  0,    1,    0]],

      [[  0,    1,    0],
        [  1,    1,    1],
        [  0,    1,    0]],

      [[  1,    0,    1],
        [  0,    0,    0],
        [  1,    0,    1]],

      [[  1,    0,    1],
        [  0,    0,    0],
        [  1,    0,    1]],

      [[  1,    0,  10],
        [  0,  100,    0],
        [1000,    0,    1]]])
>>> # stack = np.array((a,a,a,b,b,c))
... np.diff(stack,axis=0)
...
array([[[  0,  0,  0],
        [  0,  0,  0],
        [  0,  0,  0]],

      [[  0,  0,  0],
        [  0,  0,  0],
        [  0,  0,  0]],

      [[  1,  -1,  1],
        [ -1,  -1,  -1],
        [  1,  -1,  1]],

      [[  0,  0,  0],
        [  0,  0,  0],
        [  0,  0,  0]],

      [[  0,  0,  9],
        [  0, 100,  0],
        [999,  0,  0]]])
later
- Mark as New
- Bookmark
- Subscribe
- Mute
- Subscribe to RSS Feed
- Permalink
I think Dan Patterson had it 95% right the first time (the chg and pos arrays are great), and then bypassed the problem and took it to the moon. Really, you just need to append the first array (12 items) to itself (24 items) to capture the wraparound.
>>> import numpy as np
... year1 = np.array([1,0,0,1,1,1,1,0,1,1,1,1],dtype=bool) # year data
... print year1
... doubleYear1 = np.append(year1,year1) # append year data to itself
... print doubleYear1
... chg = (doubleYear1[:-1] ^ doubleYear1[1:]) # change array. Ingenious, really.
... print chg
... pos = np.arange(len(chg))[chg] # indices of change
... print pos
... diff = np.diff(pos) # difference between n+1 and n
... print diff
... max_seq = np.max(diff) # max
... print max_seq
... if max_seq > 12:
...     max_seq = 12

[ True False False  True  True  True  True False  True  True  True  True]

[ True False False  True  True  True  True False  True  True  True  True
  True False False  True  True  True  True False  True  True  True  True]
[ True False  True False False False  True  True False False False False
  True False  True False False False  True  True False False False]
[ 0  2  6  7 12 14 18 19]

[2 4 1 5 2 4 1]

5
- Mark as New
- Bookmark
- Subscribe
- Mute
- Subscribe to RSS Feed
- Permalink
Darren Wiens yes, definitely, but it sometimes depends on perspective...lets try rolling/padding by 1 position/year.
In this example the first year and the last year are the same.
>>> a = np.array([1,0,0,1,1,1,1,0,1,1,1,1],dtype=bool) # with first and last month the same
>>> b = np.roll(a,-1)
>>> chg = (b ^ a)
>>> pos = np.arange(len(chg))[chg]
>>> diff = np.diff(pos)
>>> max_seq = np.max(diff)
>>> max_seq
4
>>> a.astype(int)
array([1, 0, 0, 1, 1, 1, 1, 0, 1, 1, 1, 1])
>>> b.astype(int)
array([0, 0, 1, 1, 1, 1, 0, 1, 1, 1, 1, 1])
>>> chg.astype(int)
array([1, 0, 1, 0, 0, 0, 1, 1, 0, 0, 0, 0])
>>> pos
array([0, 2, 6, 7])
>>> diff
array([2, 4, 1])
>>>
So the question becomes how far do you roll (12 years as in your case)?
But what if the, first year and the last year are different?
>>> a = np.array([1,0,0,1,1,1,1,0,1,1,1,0],dtype=bool) # with last month different than first
>>> b = np.roll(a,-1)
>>> chg = (b ^ a)
>>> pos = np.arange(len(chg))[chg]
>>> diff = np.diff(pos)
>>> max_seq = np.max(diff)
>>> # results........
>>> a.astype(int)
array([1, 0, 0, 1, 1, 1, 1, 0, 1, 1, 1, 0])
>>> b.astype(int)
array([0, 0, 1, 1, 1, 1, 0, 1, 1, 1, 0, 1])
>>> chg.astype(int)
array([1, 0, 1, 0, 0, 0, 1, 1, 0, 0, 1, 1])
>>> pos
array([ 0,  2,  6,  7, 10, 11])
>>> diff
array([2, 4, 1, 3, 1])
>>> max_seq
4
The same results are yielded, largely by coincidence since the first and last year are different
It is interesting that you can roll forward or backward as long as you keep track of your positions.
You can also use padding with different pad widths and types AND direction. In this example the edges were padded with their neighbor.
>>> a = np.array([1,0,0,1,1,1,1,0,1,1,1,1],dtype=bool) # with first and last month the same
>>> b = np.pad(a,1,mode="edge")
>>> b.astype(int)
array([1, 1, 0, 0, 1, 1, 1, 1, 0, 1, 1, 1, 1, 1])
>>> chg = (b[:-1] ^ b[1:])
>>> pos = np.arange(len(chg))[chg]
>>> diff = np.diff(pos)
>>> max_seq = np.max(diff)
>>> max_seq
4
It just becomes more interesting when you are trying to shift, difference and pad sequences of 2D+ arrays with or without padding or replication. As I indicated, I will try to summarize in an upcoming blog because raster size can play a role. Also, if you are only interested in limited positions within the raster, reducing the input raster to a sparse array will reduce memory needs and speed up processing time.
- « Previous
-
- 1
- 2
- Next »
- « Previous
-
- 1
- 2
- Next »